Key Findings
>> Fluorescence live-cell imaging with the Omni system allows for continuous, realtime tracking of CAR T cell cytotoxicity.
>> The effectiveness of CAR T cell killing was dose-dependent and increased with higher E:T ratios.
>> SKOV3 cells, which overexpress HER2, showed higher killing by CAR T cells as compared to A549 cells, which express lower levels of HER2.
Abstract
In vitro immune cell killing assays have proven to be a vital tool in understanding CAR T-cell efficacy. However, most of these assays only provide a static endpoint readout. Fluorescence live-cell imaging allows for real-time monitoring of CAR T-cell interactions, targeting, and cytotoxicity with cancer cells. Human epidermal growth factor receptor 2 (HER2) is a common target for CAR T-cell therapy as it is over-expressed in several cancer cells. In this study, HER2 CAR T-cells potency in 2D and 3D tumor models was assessed using fluorescence live-cell imaging with the Omni.
Introduction
Human epidermal growth factor receptor 2 (HER2) has emerged as a critical target in chimeric antigen receptor (CAR) T-cell therapy for various cancers 1, particularly lung and ovarian cancers. HER2 is notably overexpressed in a significant portion of A549 lung cancer cells and SKOV3 ovarian cancer cells, making these cell lines valuable models for studying HER2-targeted therapies2. HER2-specific CAR T-cells have shown substantial cytotoxicity and cytokine-secreting abilities against HER2-positive cancer cells in vitro3. In vivo studies with patient-derived xenograft (PDX) models have shown promising results in preventing tumor progression and enhancing immunotherapeutic outcomes for HER2-positive cancers 4. Furthermore, recent advancements in low-affinity HER2 CAR T-cells offer a promising path forward by safely regressing HER2-positive tumors while minimizing off-target effects3.
Despite the transformative potential of CAR T-cell therapy, applying this approach to solid tumors such as lung and ovarian cancers poses significant challenges, including high toxicity, relapse rates, and the impermeable tumor microenvironment3. The expression levels of the HER2 receptor differ between SKOV3 ovarian cancer cells and A549 lung cancer cells, with SKOV3 cells exhibiting higher HER2 expression2. This variability impacts the efficacy of HER2-targeted therapies, as the higher HER2 expression in SKOV3 cells makes them more responsive to these treatments compared to the A549 cells2. Understanding and leveraging these differences in HER2 expression are crucial for optimizing therapy and improving clinical outcomes in both lung and ovarian cancers.
In vitro potency assays are traditionally endpoint assays that are often laborious to perform when investigating different experimental conditions. Furthermore, these assays may fail to fully capture the kinetics of CAR T-cell cytotoxicity. Therefore, fluorescence live-cell imaging can play a pivotal role in advancing CAR T-cell research by enabling real-time monitoring of CAR T-cell interactions with fluorescent HER2-positive cancer cells. Imaging technology allows researchers to observe the dynamic processes of CAR T-cell targeting and cytotoxicity, thereby providing critical insights into the efficacy and mechanisms of CAR T-cell therapies. In this study, we demonstrate the use of the Omni imaging system to evaluate fluorescent monolayer (2D) and cancer spheroid (3D) potency assays.
Materials and Methods
Cells and reagents
GFP fluorescent A549 cells (Innoprot, Ref. P20118) and green fluorescent SKOV3 cells (Innoprot, Ref. P20119) were cultured according to the manufacturer’s recommendations. CAR T-cells targeting HER2 antigen (Cat. PM-CAR1024) were purchased from ProMab Biotechnologies (Richmond, CA) and cultured in RPMI-1640 medium (ThermoFisher, Cat. 11875093) supplemented with 10% FBS and 1% Penicillin Streptomycin.
2D potency assay
A549-GFP cells were detached and counted using the Exact FL (Axion Biosystems). Next, the cells were plated at 2,500 cells per well and placed on the Omni, which captured brightfield and green fluorescence images every 5 hours to monitor cell adhesion and growth. After 24 hours, CAR T-cells were added to the A549 cells at the following effector: target (E:T) ratios; 0:1 (Ctrl), 1:10, 1:5, 1:2, 1:1, and 5:1 (n=4 per condition). The plate was placed back on the Omni and imaged every 6 hours.
3D potency assay
First, a 96-well U-bottom plate (VWR, Cat. 734-2782) was prepared by adding 100 μL Anti-Adherence Rinsing Solution (Stem Cell Technologies, Cat. 07010) to each well that was used. The plate was incubated for 15 minutes at room temperature, followed by aspiration of the Anti-Adherence Rinsing Solution. A549-GFP cells and SKOV3-GFP cells were detached from flasks and dissociated via trypsinization and counted using the Exact FL (Axion Biosystems). Next, the cells were centrifuged of 20,000 cells/mL, and 100 μL cell suspension was added to the prepared 96-well U-bottom plate and then centrifuged at 1000 rpm for 4 minutes. After 48 hours of incubation, CAR T-cells were added to the SKOV3-GFP and A549-GFP spheroids with the following effector: target (E:T) ratios; 0:1 (Ctrl), 1:10, 1:5, 1:2, 1:1, 2:1, 5:1 and 10:1 (n=4 per condition). The plate was placed back on the Omni and imaged hourly for 72 hours.
Results
Fluorescent live-cell imaging and analysis
The Omni AxIS Vue software provides real-time quantification of fluorescent metrics, enabling users to study immune cell killing assays, including CAR T-cell-mediated killing in both 2D and 3D tumor spheroid models. The software captures real-time images that track changes in tumor cell morphology, allowing for the quantification of tumor cell proliferation and death through image analysis (Figure 1).
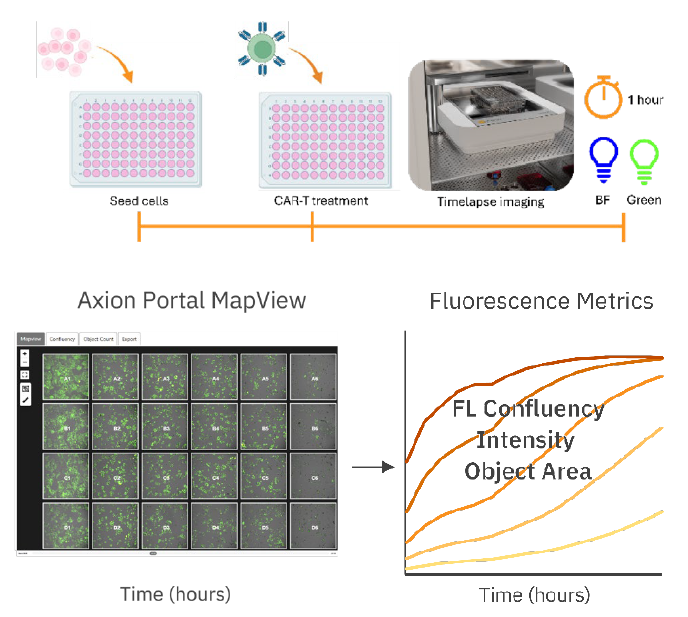
24-48 hours before addition of various E:T ratios of HER2 CAR
T-cells. Thereafter, high-resolution scans were made hourly
using the Omni, using the brightfield and green channel.
(Bottom). Analysis workflow: The AxIS Vue software displays
images at each scanned timepoint in a map view format.
Various fluorescence metrics are plotted and can be exported
from the software.
As illustrated in Figure 2, the AxIS Vue analyzes fluorescence images by using confluency or object analysis modules to measure multiple fluorescent metrics that can be used to assess target cell viability and coverage.
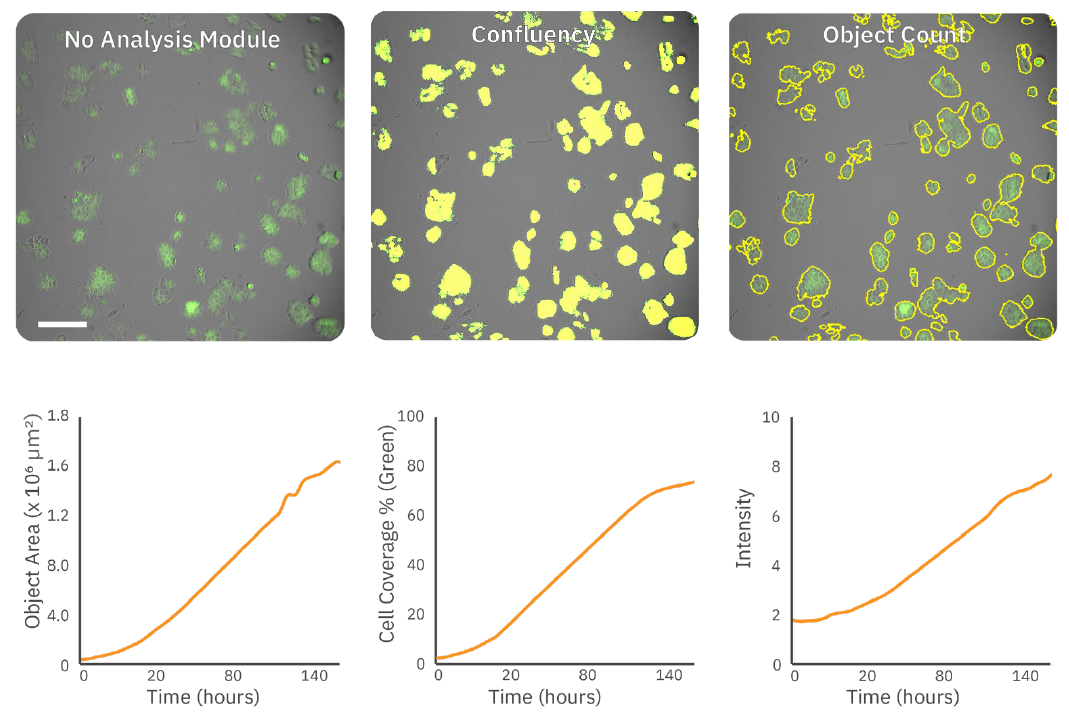
examples of the fluorescent confluency algorithm (yellow overlay) and the fluorescent object
count algorithm (yellow outline) of the total cell population. (Bottom) Using these algorithms,
quantification of cell proliferation over time can be measured and represented by fluorescence
confluency (%), intensity, and object area.
Table 1 provides metric definitions and outlines recommended use cases for each metric. In summary: fluorescence confluency (%) can be used to measure overall cell coverage; intensity accurately reflects changes in fluorescence intensity or expression levels; and object area is ideal for tracking changes in size of fluorescently labeled objects.
| FL Metrics | Definition | When to use |
| FL Confluency (%) | Quantifies overall coverage of fluorescent cells |
|
| Intensity | Quantifies average fluorescence intensity |
|
| Object Area (μm2) | Quantifies area of fluorescent cells |
|
CAR T-cell-mediated cytotoxicity of A549 cells is quantified in real time
The Omni enables real-time monitoring of the dynamic interactions between CAR T-cells and target cells. The cytotoxic potential of HER2 CAR T-cells was evaluated by comparing the fluorescence-based (green) confluency of A549-GFP cells at multiple time points and varying E:T ratios. The attachment, proliferation, and killing of A549 cells were imaged and quantified every 5 hours throughout the experiment. As expected, A549 cells treated with CAR T-cells exhibited dose-dependent decrease in fluorescence confluency (%), with near-complete cell lysis observed in the 5:1 E:T ratio group at 160 hours (Figure 3).
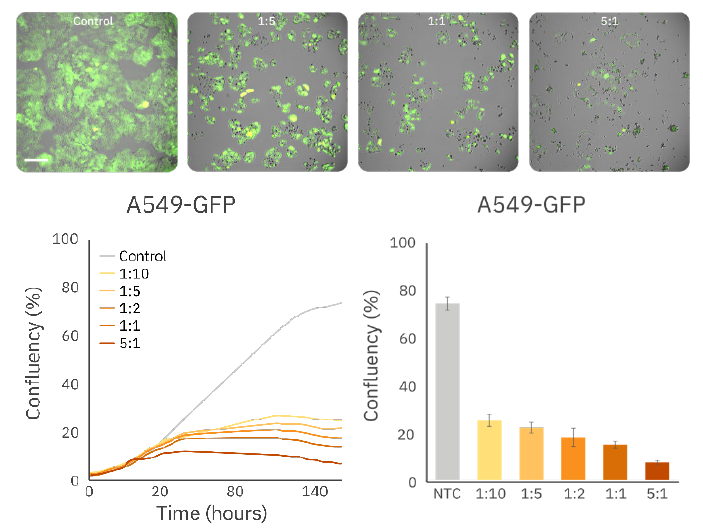
decrease in confluency post CAR T addition (Top) Fluorescent
images of A549-GFP cells treated with CAR T-cells at various
E:T ratios. (Bottom, left) Time course of fluorescent confluency
of A549-GFP cells. (Bottom, right) Bar plot demonstrating
A549 confluency at 160 hours various E:T ratios.
Similar trends were seen when assessing changes in total object area (Figure 4). For 2D potency assays, fluorescent confluency (%) or object area can be used to assess overall cell coverage in the field of view and can accurately demonstrate differences in target cell proliferation and/or viability in response to CAR T addition.
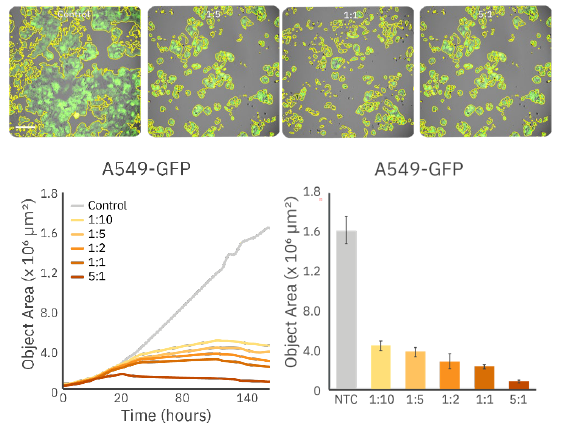
decrease in confluency post CAR T addition (Top) Fluorescent
images of A549-GFP cells treated with CAR T-cells at various
E:T ratios. (Bottom, left) Time course of fluorescent object area
of A549-GFP cells. (Bottom, right) Bar plot demonstrating
A549 confluency at 160 hours various E:T ratios.
CAR T-cell demonstrates antigen-specific killing of cancer spheroids
The expression of the CAR within the immune cell population and its affinity for the target antigen are crucial factors in determining the potency of CAR T-cells. Immune cell-mediated killing was assessed by applying HER2-targeted CAR T-cells to both SKOV3 and A549 spheroids (Figure 5).
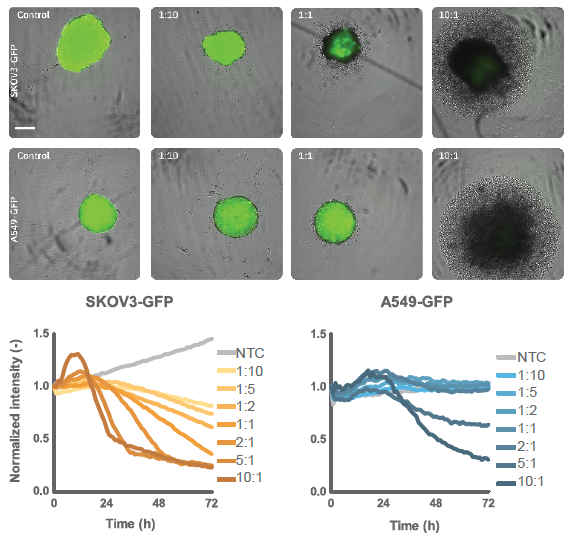
hours and (Bottom) fluorescent intensity over time for SKOV3 and
A549 cancer spheroid killing by CAR T cells. SKOV3 cells
demonstrated higher cytotoxicity than A549 cells at similar E:T
ratios, indicating that target antigen density plays a role in CAR T
potency.
At 48 hours post spheroid formation, CAR T-cells were introduced at various E:T ratios. SKOV3 spheroids treated with CAR T-cells showed a dose-dependent decrease in fluorescence intensity, with higher E:T ratios (2:1, 5:1, and 10:1) resulting in approximately 75% reduction in fluorescence intensity by 72 hours. In contrast, A549 spheroids only exhibited significant killing at 5:1 and 10:1 E:T ratios, while minimal decreases in intensity were observed at other ratios (Figure 4). Non-treated spheroids showed continuous growth over time, indicated by a steady increase in fluorescence intensity. For 3D potency assays, intensity can be used to monitor subtle changes and loss of fluorescence expression levels over time that correlate with changes in cell viability.
Conclusion
The Omni platform enables real-time monitoring of CAR T-cell interactions with target cells, providing key insights into the cytotoxic potential of these engineered immune cells. Fluorescent metrics were used to track immune cell-mediated killing, with changes in fluorescence confluency and intensity reflecting the extent of target cell death. Results showed that the potency of CAR T-cell-mediated cytolysis was dose-dependent, with higher E:T ratios leading to greater target cell killing. SKOV3 spheroids, which overexpress HER2, were more susceptible to HER2 CAR T-cell-mediated killing, while A549 spheroids with low HER2 expression required higher E:T ratios for effective cytolysis. These findings suggest that the efficacy of CAR T-cell therapies may be influenced by the target antigen expression levels on cancer cells, emphasizing the need for optimized dosing and E:T ratios depending on tumor characteristics. Real-time monitoring with live-cell imaging tools like Omni provides valuable insights into the dynamics of immune cell interactions, helping to refine and improve CAR T-cell therapies.
References
1. Kunrui Zhu et al., "HER2-targeted therapies in cancer: a systematic review," Biomarker Research, vol. 12, 2024.
2. Hao Liu et al., "Target-specific cytotoxic effects on HER2-expressing cells by the tripartite fusion toxin ZHER2:2891-ABD-PE38X8, including a targeting affibody molecule and a half-life extension domain," Internation Journal of Oncology, pp. 601-609, 2015.
3. Tamer Basel Shabaneh et al., "Systemically administered low-affinity HER2 CAR T-cells mediate antitumor efficacy without toxicity," Journal for Immunotherapy of Cancer, vol. 12, no. 2, 2024.
4. Jie Xu et al., "HER2-specific chimeric antigen receptor-T-cells for targeted therapy of metastatic colorectal cancer," Cell Death & Disease, vol. 12, 2021.
Authors
Lieke Stemkens, Senior Application Scientist
Julia van den Beemd – Application Scientist II
Inge Thijssen - van Loosdregt, Staff Application Scientist
Nathalie Opdam-van de Laar, Senior Application Scientist
Denise Sullivan, Manager, Cell Biology
Axion Biosystems, Eindhoven, The Netherlands