Cell Signaling

Cell Signaling
Request Information

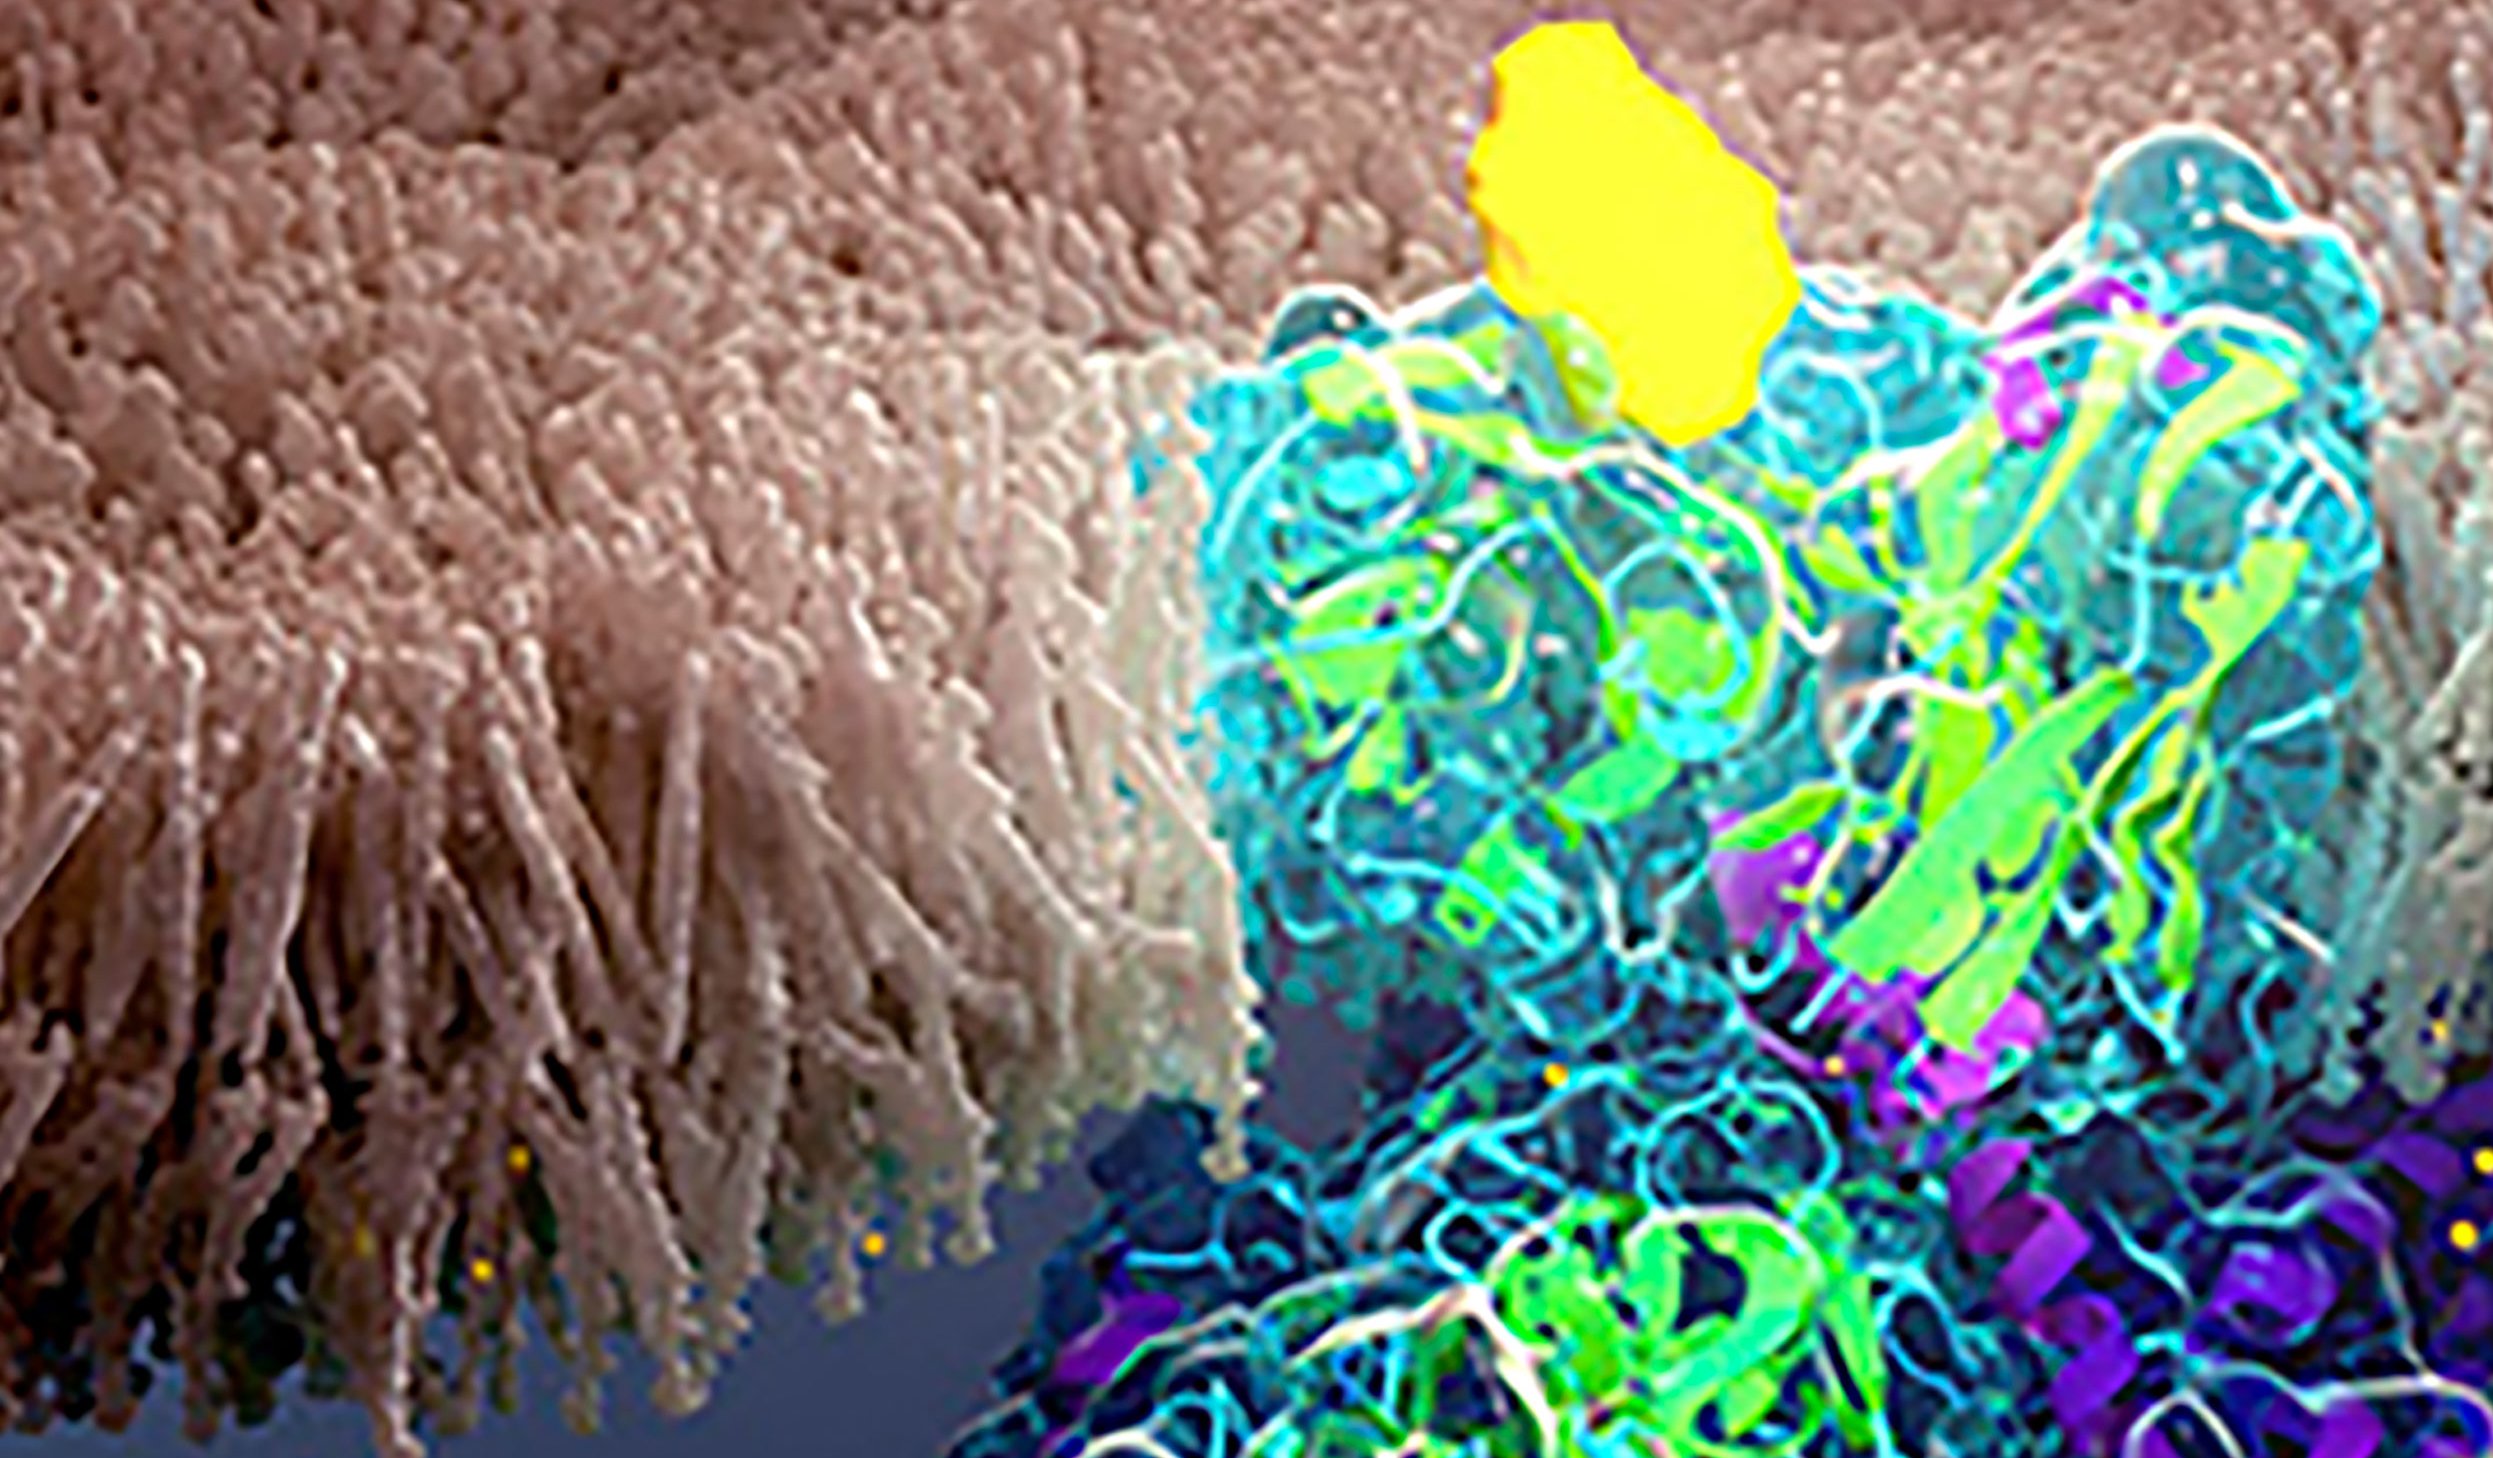
Cell signaling pathways communicate messages from outside the cell. When extracellular signal molecules bind receptors on the cell surface, they initiate signaling events inside the cell that determine cell behavior. These small changes often occur rapidly, but can last minutes to hours with significant physiological consequences.

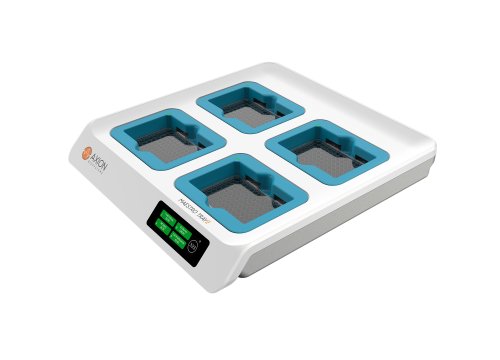
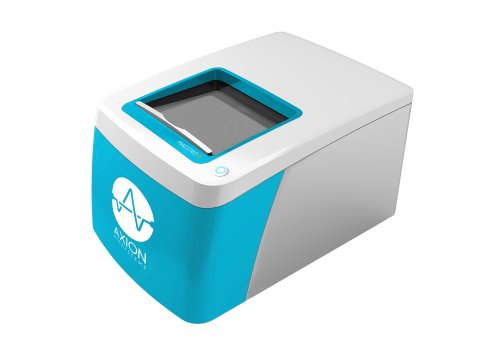
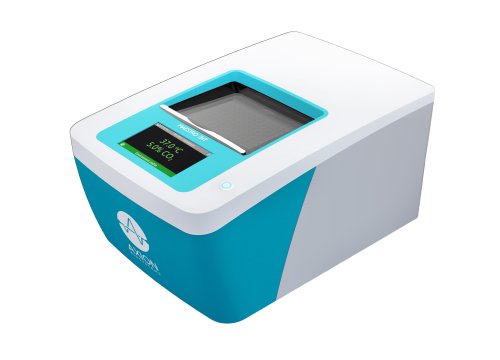
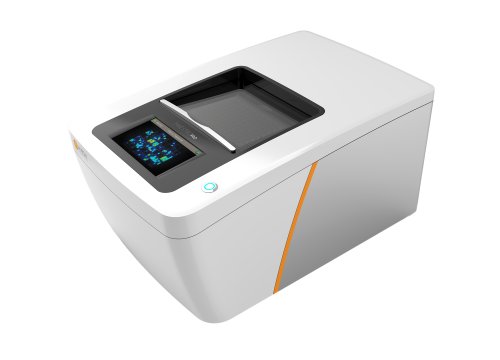
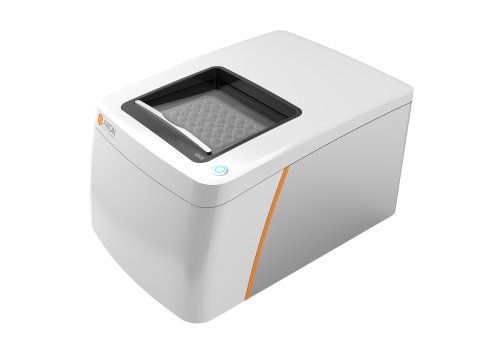
Axion BioSystems' Maestro Z, ZHT, Pro, and Edge systems now offers impedance-based cell analysis for real-time, continuous, label-free monitoring of your cells. Continuous data reveals the kinetics of receptor-mediated signaling for better mechanistic understanding without the time- and cost-intensive process of repeating multiple endpoint assays.


Monitor Rapid Receptor-Mediated Signaling in Real Time

G protein-coupled receptors (GPCRs) are the largest class of transmembrane receptors. GPCR binding results in conformational changes and downstream responses that can be measured by impedance. The Maestro Z platform was used to track the dynamic response of Calu-3 cells to isoproterenol, histamine, and cytochalasin d; revealing important information on the kinetics of cellular response to each compound.

Cells grown to confluence on a microelectrode array


Calu-3 cells seeded on a Cytoview-Z plate and impedance was continuously monitored on the Maestro Z
Impedance measurement at 20 mins post dose of different concentrations of isoproterenol.
Cell signaling dynamics varied with compound mechanism.

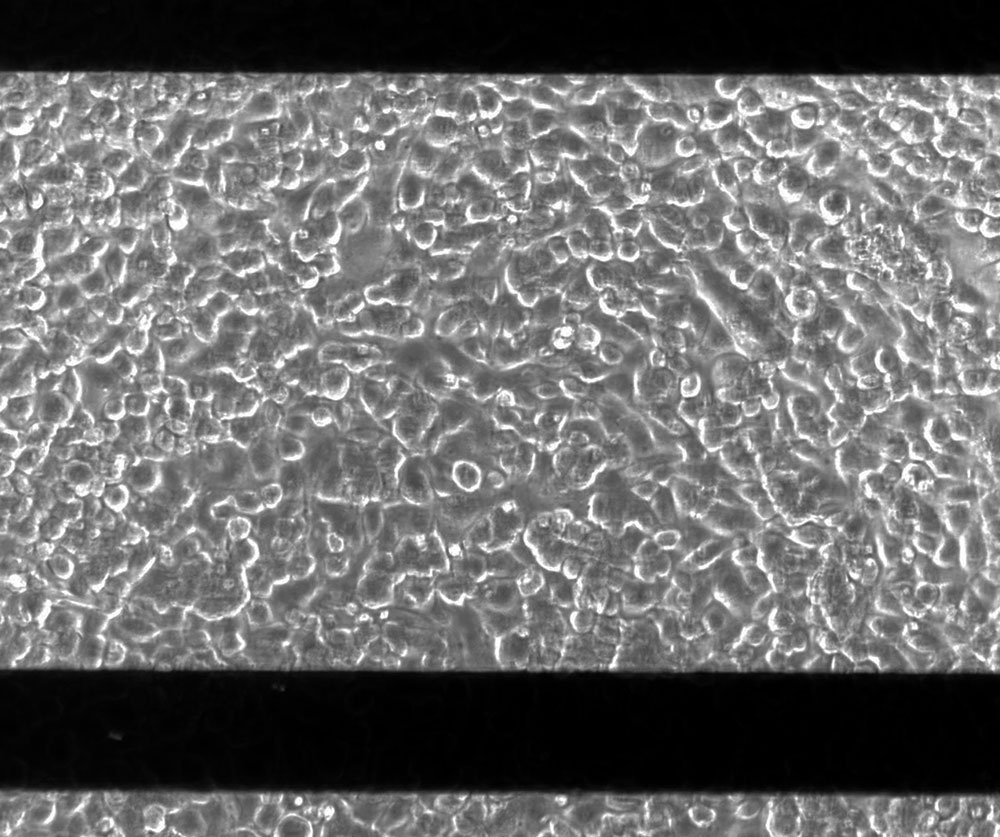
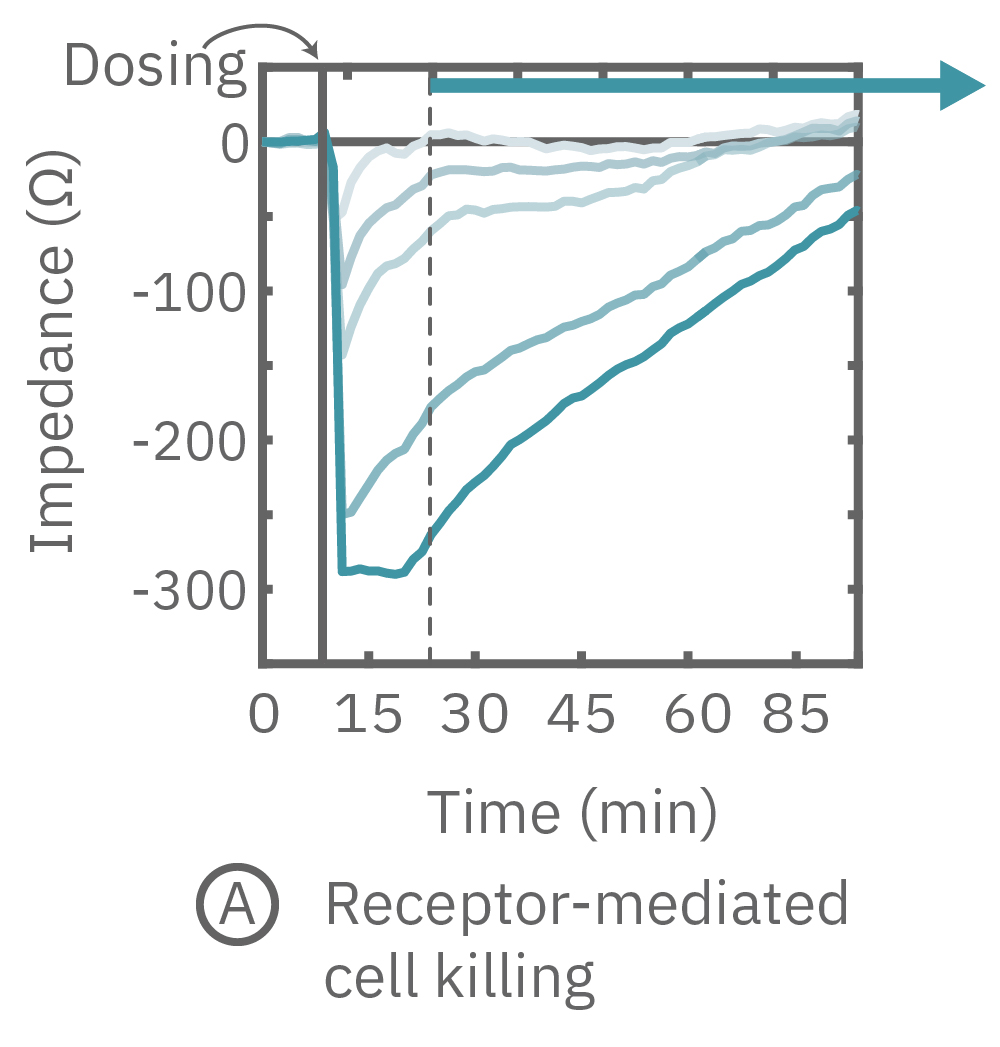
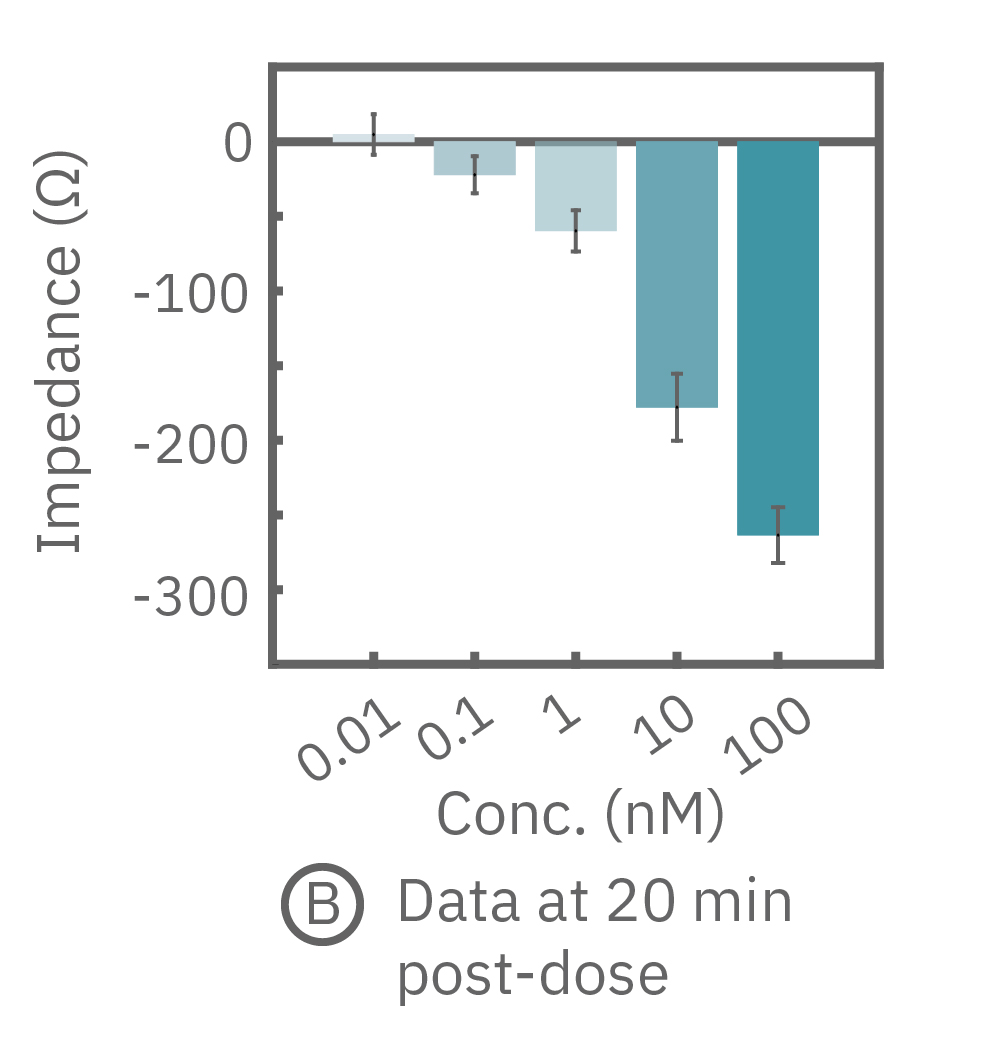
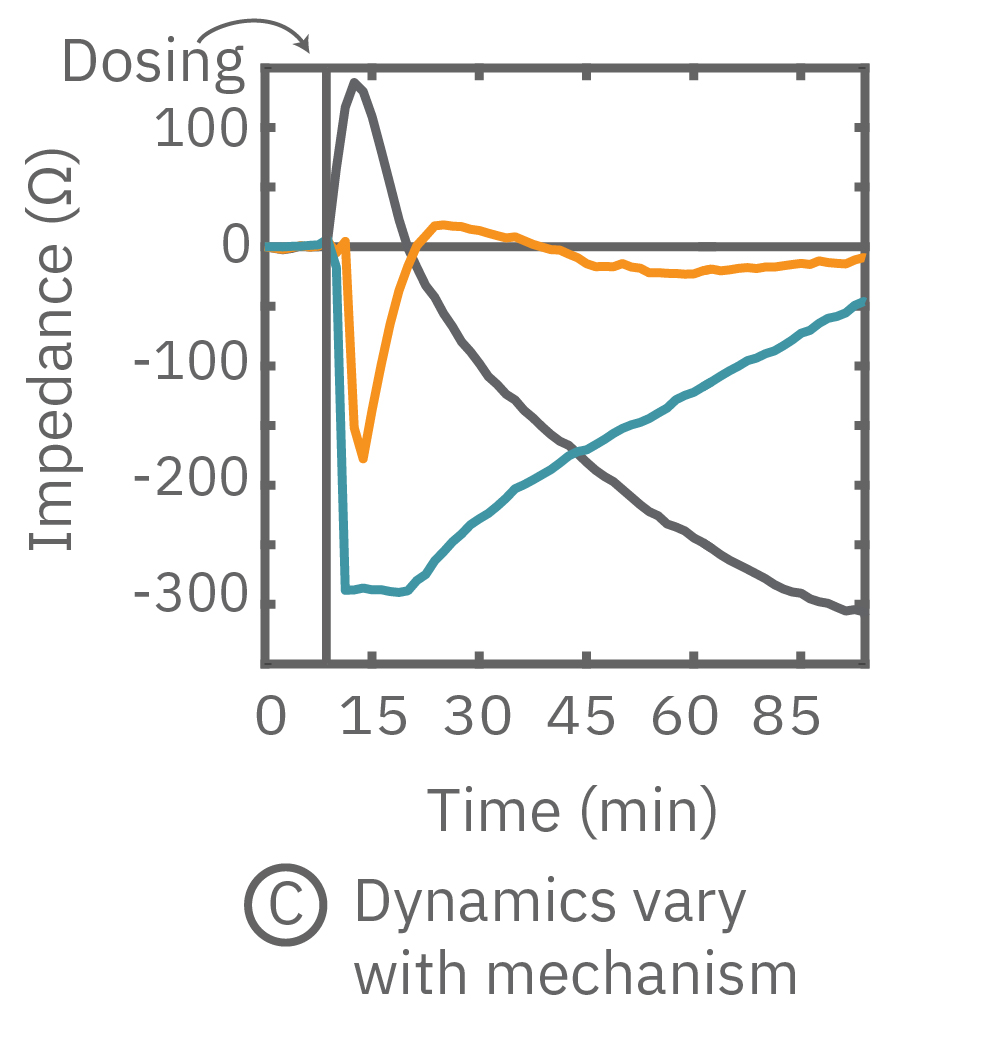
Calu-3 cells were seeded into the CytoView-Z plate and impedance was continuously monitored on the Maestro Z system. (A) When dosed with isoproterenol (teal), a potent beta-adrenergic receptor agonist, the impedance assay revealed a short-term dose-dependent decrease in impedance. (B)At 20 minutes post-dose, the cells dosed with the highest concentration showed the lowest impedance, while cells dosed with the lowest concentration had already returned to baseline. (C) Cell signaling dynamics varied with compound. Histamine (orange, 100 µM) showed a short rapid decrease in impedance, while cytochalasin D (gray) caused an initial increase and subsequent decrease in impedance related to actin inhibition and cell cycle arrest.

Cell Signaling assay protocol

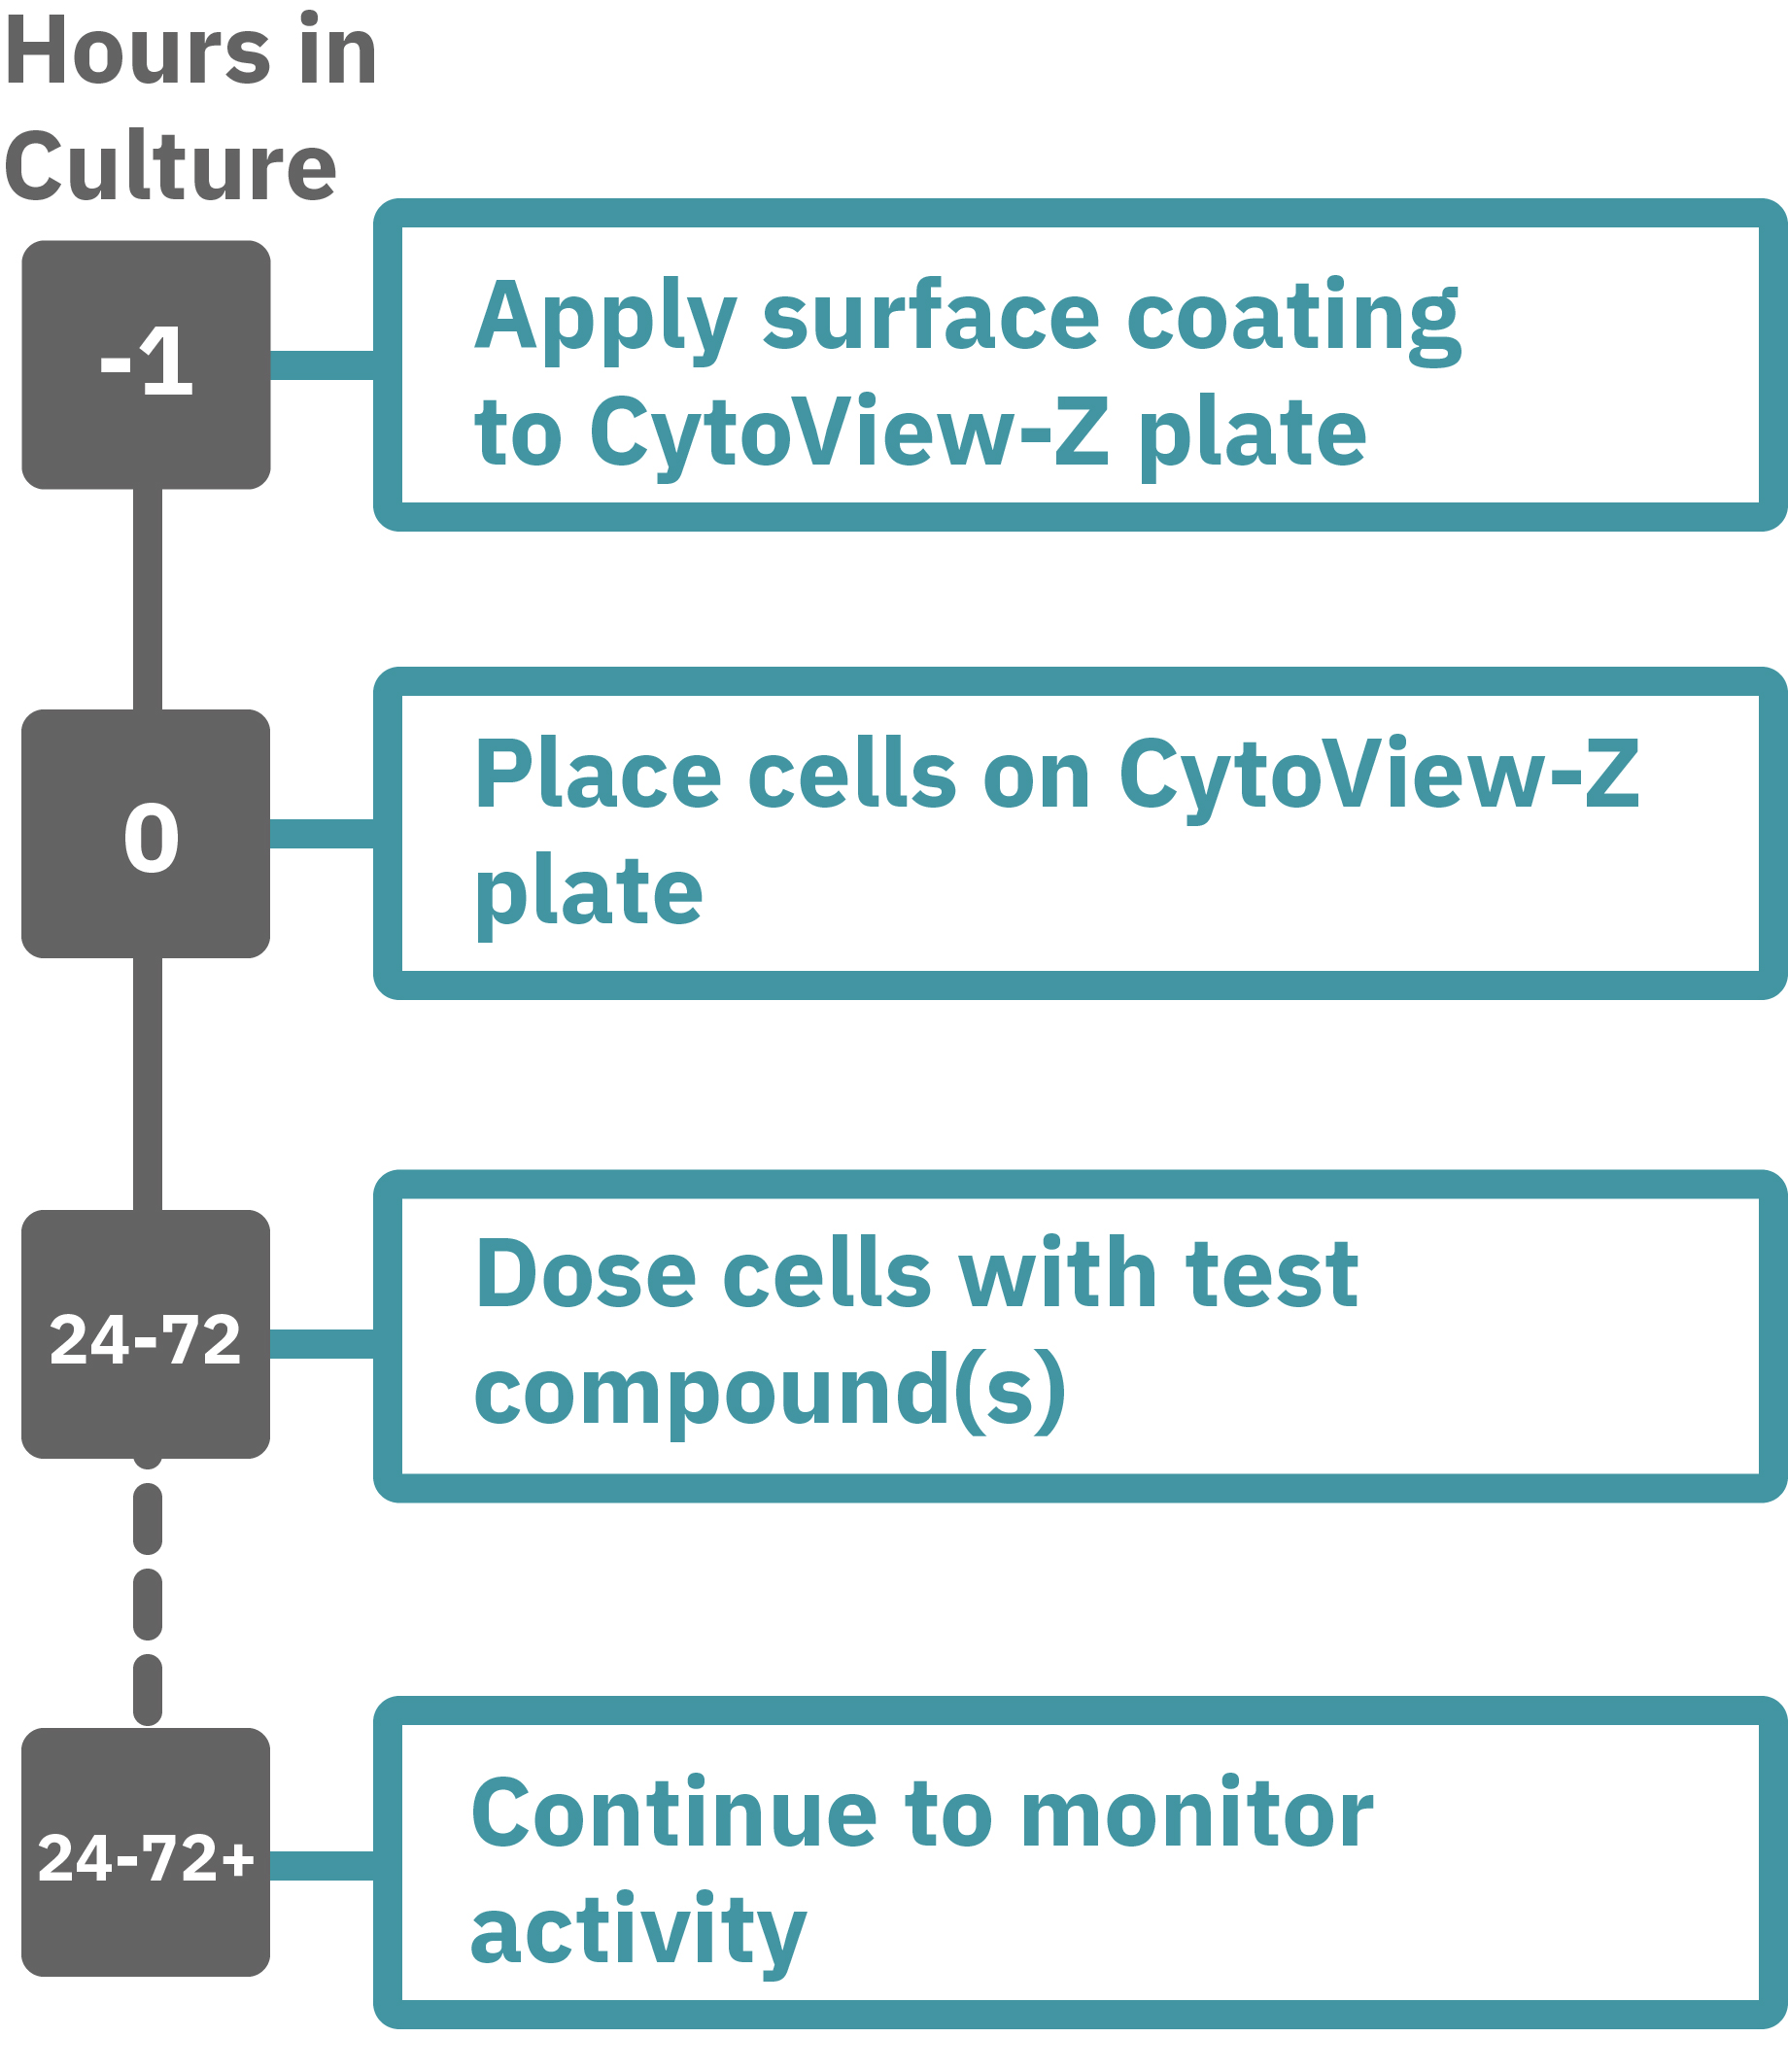
Getting started with Maestro Z, ZHT, Pro, and Edge couldn't be easier. Culture your cells in an Axion multiwell CytoView-Z plate (Hour 0). Load this plate into the Maestro system and allow the environmental chamber to automatically equilibrate. Observe cells adhering to the plate and proliferating as changes in the recorded impedance signal. Add test compounds as required (Hour 24-72). Track changes in signaling in the CytoView-Z plate label-free and in real-time with Impedance Module software.


Maestro Z user


The advantages of measuring GPCR cell signaling on the Maestro Z, ZHT, Pro, and Edge platforms:

  • Continuous cell monitoring – 96 simultaneous live recordings from your cells. Now you can track GCPR cell signaling in real time, even when you are out of the lab.

  • Analyze cell activity label-free – Perform noninvasive electrical measurements from the cultured cell population, circumventing the use of dyes/reporters that can perturb your cell model and confound results.

  • Precise assay environment – No need for an additional cell culture incubator, saving valuable lab space and money. The smart environmental chamber finely controls heat and CO₂ while rejecting electrical noise and mechanical vibrations.

  • See your cells – Sometimes you just want to look at your cells under a microscope. The Cytoview Z 96-well plates have a viewing window in each well which allows cell visualization.

  • Probe cell models in the same plate they were cultured in – other higher throughput platforms (e.g. flow cytometry) often require cell samples to be transferred into a single-cell suspension before testing. In the case of adherent cells this is not ideal since they exist as a functional network of interlinked cells.

  • Smart phone App for your assay – You can't always be in the lab. But changes in GCPR cell signaling seldom occur at convenient time points. The Maestro Z App allows you to see live results and system status.

  • It’s easy – With effortless assay setup and intuitive analysis software designed for quick export of figures and results, you can now focus on the science.

Impedance Technology

Impedance - General


Impedance: For real-time cell analysis

Impedance-based cell analysis is a well-established technique for monitoring the presence, morphology, and behavior of cells in culture. Impedance describes the obstruction to alternating current flow. To measure impedance, small electrical currents are delivered to electrodes embedded in a cell culture substrate. The opposition to current flow from one electrode to another defines the impedance of the cell-electrode interface. When cells are present and attached to the substrate, they block these electrical currents and are detected as an increase in impedance.

Impedance is sensitive to many aspects of cell behavior: attachment, spreading, shape,  cell-cell connections (e.g. tight junctions), and death. Even small transient changes, such as swelling or signaling, are detectable by impedance. Because impedance is noninvasive and label free, the dynamics of these changes can be monitored in real time over minutes, hours, or even days without disturbing the biology.

Interdigitated electrodes embedded in the cell culture substrate at the bottom of each well detect small changes in the impedance of current flow caused by cell presence, attachment, and behavior.

Interdigitated electrodes embedded in the cell culture substrate at the bottom of each well detect small changes in the impedance of current flow caused by cell presence, attachment, and behavior.

In the example below, the electrodes are initially uncovered before cells are added. The electrical current passes easily and the impedance is low. When cells begin to attach and cover the electrodes, less electrical current passes and the impedance is high. After dosing with a cytotoxic agent, cells die or detach, and the impedance decreases back towards baseline.

Cells on electrode
Dosing cells and recording impedance

Impedance measures how much electrical signal (orange arrows) is blocked by the cell-electrode interface. Impedance increases as cells cover the electrode and decreases back to baseline due to cell death.


Continuous cell monitoring

Many cell-based assays are endpoint assays, limited to a single snapshot in time. Repeating these assays at multiple time points can be labor intensive, time consuming, and costly. Key time points can be easily missed. Impedance-based cell analysis is nondestructive and label free, meaning that cellular dynamics can be monitored continuously.

The impedance assay can be used to characterize dynamic cell profiles, revealing how cells grow, attach, and interact over time. Each cell type exhibits a different cell profile, or “fingerprint”, of dynamic cell behavior. These profiles are sensitive to cell type, density, purity, and environmental factors. In this example, the Maestro Z impedance assay readily distinguished cell profiles across different cell densities and cell types.

HeLa cells were seeded on a CytoView-Z plate at varying densities and the impedance was continuously monitored by the Maestro Z
Impedance scaled proportionally with cell density and readily distinguished different densities of the same cell type.
Maestro monitored the growth of three cell types, HeLa, A549, and Calu-3, and readily distinguishes their distinct cell profiles over time.

(A, B) HeLa cells were seeded on a CytoView-Z plate at varying densities and the impedance was continuously monitored by the Maestro Z. Impedance scaled proportionally with cell density and readily distinguished different densities of the same cell type. (C) Maestro monitored the growth of three cell types, HeLa, A549, and Calu-3, and readily distinguishes their distinct cell profiles over time.


The Maestro Z impedance assay can also be used to capture the kinetics of cell responses to drugs or immune cell therapies. The kinetics, which cannot be captured by endpoint assays, often provide key insights into the efficacy of novel therapies. In the example below, the Maestro Z impedance assay was used to quantify the kinetics of cytotoxicity of chemotherapy agents.

A549 were dosed with Doxorubicin, vehicle (DMSO), or Tergazyme. Wells dosed with Tergazyme showed an immediate decrease in impedance, reflecting complete cell death.
Cells dosed with 1 uM doxorubicin reached 50% cytolysis at 31 hrs.
Higher doses of Doxorubicin resulted in a slower decrease in impedance and cell death

A549 cells were dosed with dox, vehicle (DMSO), or tergazyme. Wells dosed with tergazyme showed an immediate decrease in impedance, reflecting complete cell death. Higher doses of dox resulted in a slower decrease in impedance and cell death. Cells dosed with 1 μM dox reached 50% cytolysis at 31 hrs.


Different frequencies reveal cell properties

Impedance varies with frequency, such that different frequencies reveal different aspects of cell biology. The small currents used to measure impedance will always take the path of least resistance. At low frequencies, such as 1 kHz, the impedance of the cell membrane is relatively high, forcing the current to flow under and between the cells. Low frequencies provide details about barrier integrity, the presence of gap junctions, and transepithelial or transendothelial resistance (TEER).

At high frequencies, such as 41.5 kHz, the impedance (and capacitive reactance) of the cell membrane is relatively low. Thus, most of the current couples capacitively through the cell membranes, providing information about the cell layer such as confluency and coverage.

In other words, low frequencies are sensitive to “what” cells are there, whereas high frequencies are sensitive to “how many” cells are there. The Maestro Z impedance assay uses multiple frequencies to provide the most information about the cells, simultaneously, continuously, and in real time.

Multiple frequencies were used to simultaneously and continuously monitory the coverage and barrier function
TEER, measured at 1 kHz, reveals that only Calu-3 cells form a strong barrier, as they express tight junctions to block flow between neighboring cells.

Multiple frequencies were used to simultaneously and continuously monitor the coverage and barrier function (TEER) of Calu-3 and A549 cells. Coverage, measured as resistance at 41.5 kHz, increases over time for both cell types. TEER, measured at 1 kHz, reveals that only Calu-3 cells form a strong barrier, as they express tight junctions to block flow between neighboring cells.