Key Findings
>> Assay steps such as target cell rest, heater plate slow ramp, and reservoir water addition help reduce edge effects in CytoView-Z plates.
>> Edge effects that occur during potency assays can be further reduced through effector cell rest.
>> Potency assays should be optimized for the given target cell and effector cells used.
>> Axion's products and protocols are optimized to produce reliable potency assay data.
Introduction
In recent years, cellular immunotherapies have shown unprecedented success in treating certain cancer types, such as B-cell acute lymphoblastic leukemia1. However, there is still a need to develop engineered cellular therapies, such as CAR T cells, that are capable of targeting and eradicating other cancer cell types, especially those present in solid tumors. The use of in vitro potency assays allows researchers to assess the quality and function of engineered cellular products, and it is important that these assays provide reliable, reproducible, and consistent measurements of immune cell killing2.
High throughput assays that rely on the use of microplates may suffer from edge effects, resulting in inconsistent data3. Herein, we provide simple techniques for reducing edge effects and optimizing in vitro potency assays conducted on the Maestro Z platform. The examples that follow provide techniques used in a typical in vitro potency assay in which target (e.g., cancer) cells are seeded and subsequently dosed with effector (e.g., CAR T) cells. A Critical Step is a protocol step that must be followed to ensure elimination of edge effects and consistent data collection across a plate. An Opportunity for Optimization refers to a step that is dependent on the parameters of a specific experiment (target cell type, effector cell type, media, etc.) and may be used to optimize these parameters. A detailed protocol on how to run an in vitro potency assay on the Maestro Z can be found Potency Assay Cell Culture Protocol.
Best Practices for Adherent Target Cell Seeding
Critical Step: Target Cell Rest
Axion BioSystems Potency Assay Cell Culture Protocol recommends a rest of target cells for 1 hour at room temperature following target cell seeding and prior to docking on the Maestro Z (step 13). Previous studies have shown that this rest can reduce edge effects on microplates that occur due to evaporation and thermal gradients4. Figure 1 shows how performing the target cell rest cell step improves impedance data recorded by the Maestro Z. A total of 5k A549 cells were plated in CytoView-Z 96 plates, and the following plate conditions were tested:
- Rest cells seeded at room temperature, rested for 1 hour at room temperature, then docked onto the Maestro Z.
- No Rest cells seeded at room temperature, then immediately docked onto the Maestro Z.
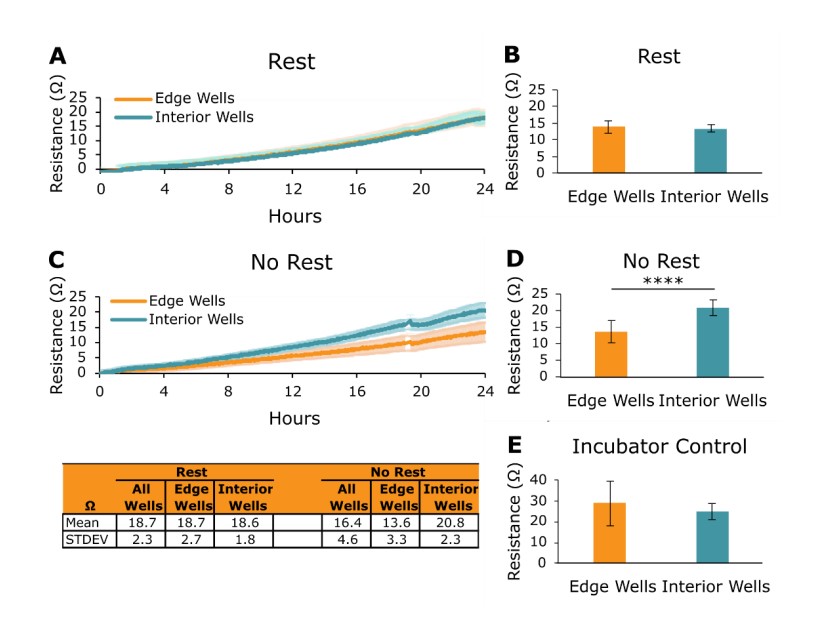
After 24 hours, the edge and interior wells of the Rest plate had nearly identical resistance values (Figure 1A and 1B). Edge wells and interior wells were also similar in the Incubator Control plate, which was rested for 1 hour following cell seeding at room temperature before being placed in a standard cell culture incubator (Figure 1E). However, on the No Rest plate, interior wells had a significantly higher resistance than the edge wells 24 hours after seeding (Figure 1C and Figure 1D, p < 0.0001). These results demonstrate the need to rest target cells for 1 hour at room temperature before docking onto the Maestro Z to reduce target cell growth edge effects, consistent with other cell-based microplate assays.
Critical Step: Slow Temperature Ramp of the Heater Plate
After a plate is docked into the Maestro Z, the system's heater plate will slowly ramp up its temperature to 37°C. This slow temperature ramp is performed to mimic the conditions of heat transfer that occur in an incubator. In the Maestro Z, the culture plate is in direct contact with a heat source (heater plate), where in an incubator, heat is transferred from the incubator to the culture plate through the air. Therefore, the slow temperature ramp of the heater plate ensures that the culture plate temperature increases to 37°C at a rate similar to that in an incubator. However, a user may choose a different set point/skip the slow temperature ramp of the heater plate by unchecking the "Auto Enable Heater" option in Axis Z (for more information, please see section 2.2.1 Environment Settings in the Axis Z User Guide). To test on target cell growth edge effects, 5k A549 cells were plated onto CytoView-Z 96 plates under the following Maestro Z heater plate conditions:
- Slow Ramp — "Auto Enable Heater" box checked temperature is slowly increased to 37°C.
- No Slow Ramp — "Auto Enable Heater" box unchecked, temperature is immediately increased to 37°C
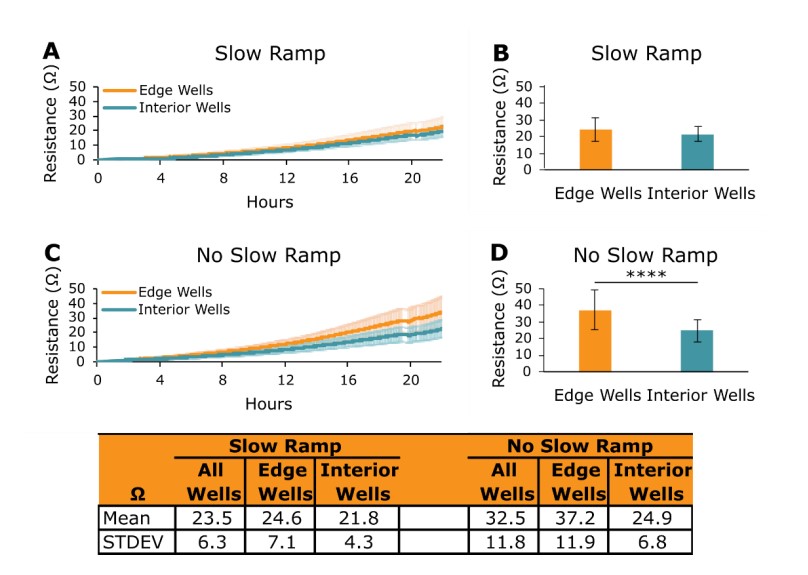
Figure 2 shows the resistance values of edge and interior wells 24 hours after cell seeding on Slow Ramp and No Slow Ramp plates. Resistance values for edge and interior wells in the Slow Ramp plate were similar to one another (Figure 2A and 2B), while the resistances in edge wells in the No Slow Ramp plate were significantly greater than those in the interior wells (Figure 2C and 2D, p < 0.0001). These data highlight the importance of the Maestro Z heater plate's slow temperature ramp to 37°C for producing consistent data in each well across an entire plate.
Critical Step: Fill On-Plate Reservoirs with Water
In Axion BioSystems Potency Assay Cell Culture Protocol, Step 4 recommends adding 8 mL of sterile water to the on-plate reservoirs located on the perimeter of CytoView-Z plates when seeding target cells. Adding water to the reservoirs increases the humidity of the plate's environment and helps limit evaporation on the edge wells of the plate. To investigate the impact of water in the on-plate reservoirs, 5k A549 cells were seeded onto CytoView-Z 96 plates with the following conditions:
- Reservoir Water — 8 mL of sterile water was pipetted into the on-plate reservoirs.
- No Reservoir Water — the on-plate reservoirs were left empty.
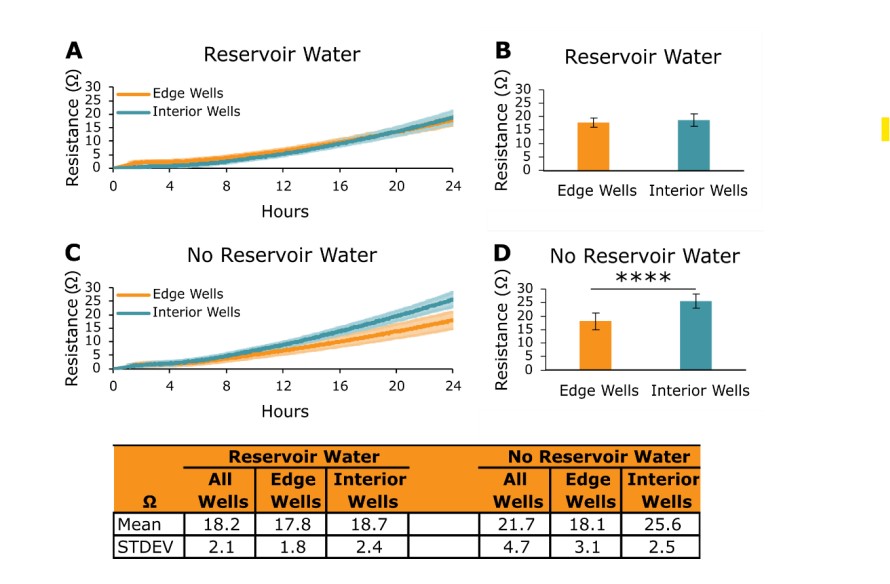
Impedance data from Reservoir Water and No Reservoir Water plates were collected on the Maestro Z over 24 hours (Figure 3). Edge wells and interior wells in the Reservoir Water plate had resistance values that were very similar to one another (Figure 3A and 3B). In the No Reservoir Water plate, interior wells had a significantly larger resistance than edge wells (Figure 3C and 3D, p < 0.0001). These outcomes illustrate the critical nature of adding water to the on-plate reservoirs of the CytoView-Z plates when performing potency assays on the Maestro Z.
Opportunity for Optimization: Density Sweep
Potency assays can be employed to assess immunotherapies against a wide variety of cancer (target) cell types. However, these different target cell types may exhibit growth kinetics that vary greatly. Therefore, it is important to empirically determine the optimal initial seeding density and time in culture before adding treatments. These experiments are typically referred to as "density sweeps." Figure 4 shows both an example density sweep for two cancer cell types, MCF7 and SKBR3, and illustrates the effects of confluence on peripheral blood mononuclear cell (PBMC) killing of A549 cancer cells.
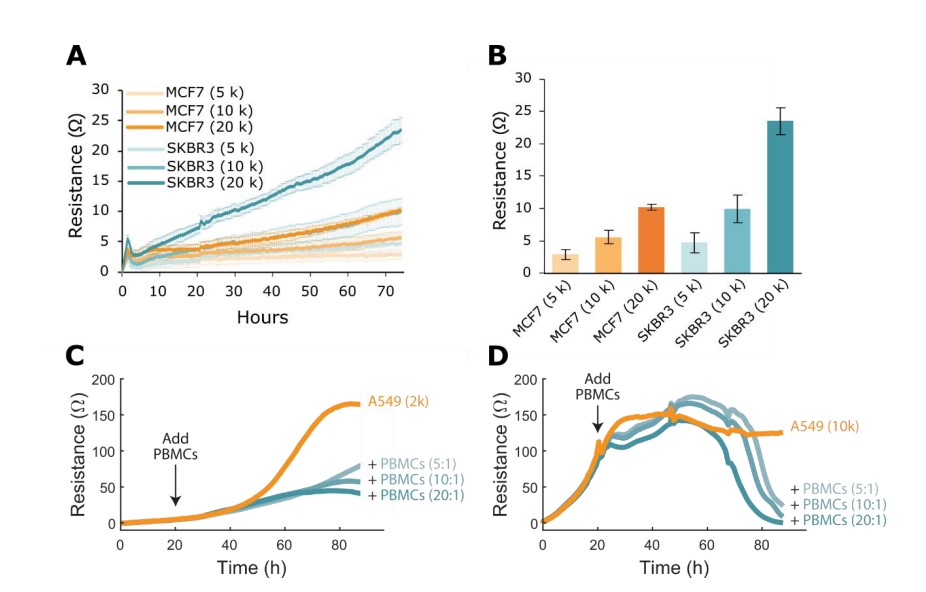
Three initial cell densities of MCF7 or SKBR3 cells, 5k, 10k, and 20k, were seeded onto CytoView-Z 96 plates and placed onto the Maestro Z for 24 hours. Figure 4A displays the growth kinetics of these cells over times, while Figure 4B shows their endpoint resistance values. MCF7s have relatively low resistance values, indicating that they are a slow-growing cell line. SKBR3s, in contrast, have higher resistance values that are close to double that of the MCF7s. For both cell lines, as seeding density doubles, resistance values also double, highlighting the linear relationship between resistance and cell density.
The effect of target cell density on potency experiments is further illustrated in Figures 4C and 4D, where 2k or 10k A549 cells, respectively, were seeded into CytoView-Z 96 plates and subsequently dosed with PBMCs. Impedance data measured on the Maestro Z showed that dosing A549 cells in their log growth phase (2k) led to a stunting of A549 culture growth but not complete cytolysis (Figure 4C). Dosing the fully confluent A549 cells (10k), in contrast, led to nearly complete cytolysis (Figure 4D). Therefore, density sweep experiments may be important to determine the initial seeding density and time in culture before dosing the target cells with a treatment. These target cell parameters may be then fined-tuned to produce the desirable kinetics of target cell growth and/or effector cell killing. In total, optimizing target cell seeding through a density sweep helps identify the proper time of dosing and helps ensure the success of the potency assay.
Best Practices for Effector Cell Addition
Opportunity for Optimization: Volume of Effector Cell Dose
Selecting the optimal composition of cell culture media is vital for cell growth and survival in culture5. Media composition can also affect cell function, such as immune cell cytotoxicity6. In a typical potency assay, effector cells are dosed by adding a desired effector cell number to target cells that have been previously seeded into a microplate. However, the media used to culture target cells may be different from that used to culture effector cells. Further, the same number of effector cells can be delivered in different volumes by varying the concentration of the effector cell solution. Therefore, we sought to measure how differences in the volume of effector cell dose affect the effector cell's cytotoxic potential. A total of 5k SKOV3 cells/well were plated onto CytoView-Z 96 plates, and their impedance values were monitored on the Maestro Z. At 24 hours, the SKOV3s were dosed with CAR T cells targeting HER2 at an effector to target (E:T) ratio of 1:1 (5k CAR T cells). All CAR T doses were delivered as CAR T cells suspended in CAR T cell media. The doses were added in one of the following two conditions:
- 10% media The 5k dose of CAR T cells added was 10% of the final volume of media in the well (e.g., 22.2 uL CAR T dose into 200 uL target cell media).
- 50% media The 5k dose of CAR T cells added was 50% of the final volume of media in the well (e.g., 100 uL CAR T dose into 100 uL target cell media).
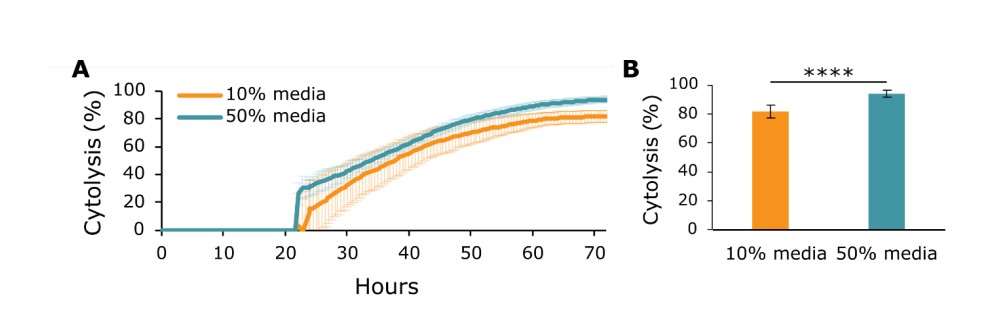
Figure 5A shows data of CAR T cell killing measured on the Maestro Z over the 48 hours following CAR T dosing (72 hours after SKOV3 seeding). The cytolysis data illustrates that 50% media CAR T dose exhibited significantly more SKOV3 cytotoxicity than the 10% media dose (Figure 5B). Further, addition of CAR T media only (no effector cells) did not increase SKOV3 cytolysis (data not shown). This suggests that the CAR T cells have improved cytotoxic function when their culture media is a greater portion of the final media volume in the well. Therefore, with this specific target/effector cell combination, it may be beneficial to add larger dose volumes. An optimization experiment similar to the one discussed here may need to be performed to improve effector cell cytotoxicity.
Critical Step: Effector Cell Rest
After being added to a microplate, effector cells may also be subject to thermal gradients and evaporation that can affect their cytotoxic function and introduce edge effects onto the plate. For example, thermal gradients may pull the effector cells to one side of the well where they then only kill target cells in that region of the well. To combat this, Axion BioSystems Potency Assay Cell Culture Protocol recommends resting the plate for 30 minutes at room temperature after effector cell dosing and before docking the plate back onto the Maestro Z (step 21). Figure 6 shows how performing the effector cell rest step makes the effector cell function more consistent across the plate. A total of 5k SKOV3 cancer cells were seeded into CytoView-Z 96 plates, and their impedance was monitored on the Maestro Z. After 24 hours, CAR T cells targeted to HER2, a protein present on the cell membrane of SKOV3 cells, were dosed into each well of the plate at an E:T ratio of 1:1. The plates were then treated in one of the following conditions:
- Rest — the plate with effector cells added was rested for 30 minutes at room temperature and then docked onto the Maestro Z.
- No Rest — the plate with effector cells added was added immediately onto the Maestro Z.
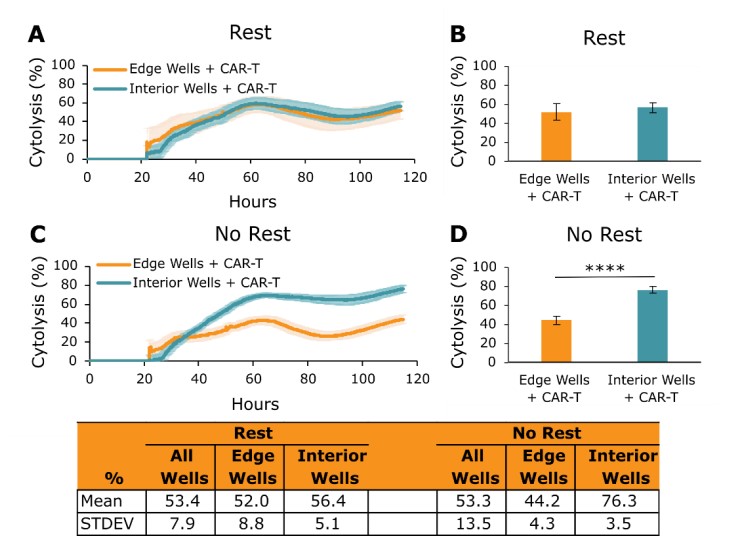
The cytotoxic function of the CAR T cells was then measured longitudinally over several days (Figure 6). Figure 6A and 6B show that, in the Rest plate, CAR T cells in the edge and interior wells exhibited similar levels of SKOV3 killing over time and at the experiment endpoint. In contrast, in the No Rest plate, CAR T cells in the interior wells had a greater cytotoxic effect than CAR T cells in the edge wells (Figure 6C and 6D, p < 0.0001). The data presented in Figure 6 illustrate the importance of resting effector cells at room temperature for 30 minutes before docking the plate onto the Maestro Z. Failure to follow this step can lead to edge effects and unreliable data across a given plate.
Conclusion
In vitro potency assays are vital to the assessment of engineered cellular therapies targeting cancer. However, to run these assays in a high throughput manner, researchers must use microplates that are inherently subject to edge effects. The steps prescribed here reduce edge effects, yield more consistent data across plates, and optimize in vitro potency assays on the Maestro Z. Following these best practices ensures the success of in vitro potency assays and produces clean, reliable data that can be used to advance the next generation of cellular immunotherapies.
References
- Jackson, H. J., Rafiq, S. & Brentjens, R. J. Driving CAR Tcells forward. Nat. Rev. Clin. Oncol. 13, 370 383 (2016).
- de Wolf, C., van de Bovenkamp, M. & Hoefnagel, M. Regulatory perspective on in vitro potency assays for human T cells used in anti-tumor immunotherapy. Cytotherapy 20, 601 622 (2018).
- Mansoury, M., Hamed, M., Karmustaji, R., Al Hannan, F. & Safrany, S. T. The edge effect: A global problem. The trouble with culturing cells in 96-well plates. Biochem. Biophys. Rep. 26, 100987 (2021).
- Lundholt, B. K., Scudder, K. M. & Pagliaro, L. A Simple Technique for Reducing Edge Effect in Cell-Based Assays. J. Biomol. Screen. 8, 566 570 (2003).
- Calmeiro, J. et al. In-Depth Analysis of the Impact of Different Serum-Free Media on the Production of Clinical Grade Dendritic Cells for Cancer Immunotherapy. Front. Immunol. 11, 593363 (2021).
- Sato, K. et al. Impact of culture medium on the expansion of T cells for immunotherapy. Cytotherapy 11, 936 946 (2009).
Authors
Benjamin Streeter, PhD, Denise Sullivan, MS, Daniel Millard, PhD
Applications Department, Axion BioSystems, Atlanta, GA