Key Findings
>> Dose response analysis included within AxIS Z allows potency quantification with the Maestro Z platform
>> Flexible and intuitive controls simplify dose response regression with the Hill equation.
>> Dose response analysis revealed a 3x lower potency of CAR T cells against 3D cancer spheroids.
>> Trastuzumab accelerates immune cell-mediated cytolysis of HER2-expressing SKOV3 cells with a 1.7 ng/mL EC50.
Abstract
Potency assessment is critical for the continued development of immunotherapy approaches, including engineered cell therapies. Dose response analysis quantifies the potency of a treatment, facilitating candidate selection, process optimization, or batch release assessment. This technical note describes the best practices for performing in vitro, live cell potency assays using the Maestro Z platform and the built-in dose response analysis in AxIS Z. Then, case studies are presented to illustrate how dose response analysis can benefit high throughput screening approaches, potency assay development with 3D models, and potency quantification for immunotherapy treatments.
Introduction
The rapidly growing field of immunotherapy aims to empower the body's own immune system to treat cancer. With multiple therapies already approved for clinical use, immunotherapy development extends from discovery to manufacturing and clinical quality control. Potency assays are critical throughout the development pipeline, but the exact goals may differ at each stage. Broadly, the potency assay must evaluate the ability of a cellular product to effect a given result when used in the intended manner for regulatory evaluation and manufacturing release. 1
In earlier stages of development, ranking of relative potency facilitates candidate selection and process/product optimization. Dose response analysis provides a quantitative assessment of potency for an immunotherapy product, including small molecules, therapeutic antibodies, and engineered cells, and can facilitate decision making early in the development process.
Dose response analysis quantifies the relationship between the dose of a product and a specific biological effect. In immunotherapy applications, this relationship describes the potency of a product as a function of concentration, for a small molecule or antibody, or effector-to-target ratio for an engineered cell product. Dose response analysis classically utilizes the Hill equation model2,3, which can incorporate the physical constraints of the system (e.g. Cytolysis must be between 0% and 100%) and provides an estimate of the dose producing the half-maximal response (IC50 or EC50).
Here, we present a series of case studies demonstrating how dose response analysis, performed directly within the AxIS Z software, can facilitate potency assessment for immunotherapy discovery and development with the Maestro Z potency assay. The case studies illustrate "best practices" for dose response analysis and quantify the EC50 for small molecules, therapeutic antibodies, and chimeric antigen receptor (CAR) T cells.
Materials and Methods
Cells and reagents
SKOV3 (Cat. HTB-77) and A549 (Cat. CCL-185) were obtained from ATCC (Manassas, VA). SKOV3 media was composed of McCoy's 5A Medium Modified (ATCC, Cat. 30-2007), 10% FBS (Gibco, Cat. 16000044), and 1 % penicillin/streptomycin (Gibco, Cat. 15140122). A549 media was composed of F12-K base media (Gibco, Cat. 1127022), 10% FBS (Gibco, Cat. 16000044), and 1% penicillin/streptomycin (Gibco, Cat. 15140122).
Mitoxantrone (Cat. 14842), doxorubicin (Cat. 15007), paclitaxel (Cat. 10461), and cisplatin (Cat. 13119) were obtained from Cayman Chemical (Ann Arbor, MI). Endoxifen (Cat. SML2368) was obtained from Sigma Aldrich (St. Louis, MO).
Human peripheral blood mononuclear cells (PBMCs; Cat. 4W-270) were obtained from Lonza (Basel, Switzerland). Trastuzumab (Cat. A2007) was purchased from Selleckchem (Houston, TX). CAR T cells targeting HER2 (HER2 scFv-4-1BB- -CAR1070-1M) and CAR T cell media (Cat. PM-CAR2001) were obtained from ProMAB Biotechnologies (Richmond, CA).
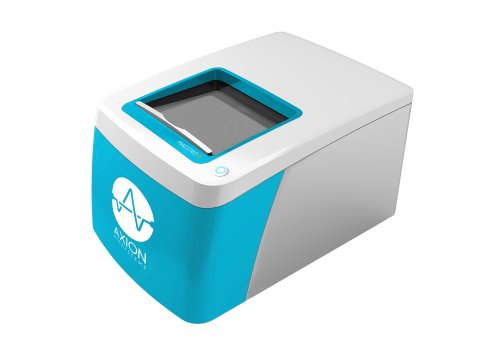
Maestro Z assay platform
The Maestro Z platform (Axion Biosystems) uses impedance measurements (ohms, Ω) to quantify the presence of cells on electrodes embedded in the bottom of the wells of CytoView-Z plates (Axion Biosystems). Cellular impedance is a well-established technique for measuring cell attachment, spreading, proliferation, coupling, membrane integrity (cell death), and subtle changes in cell conformation. Detection is noninvasive and label-free, so it can quantify dynamic cellular responses over minutes, hours, and days. The Maestro Z's built-in environmental chamber finely controls temperature and CO2, ensuring a consistent, optimal experimental environment.
Cell plating
CytoView-Z 96 plates (Axion BioSystems) were coated with 100 µL of fibronectin solution (1µg/mL) per well and incubated at 37°C and 5% CO2 for at least one hour. After incubation, excess surface coating was aspirated from each well. Then 100 µL of SKOV3 medium was added per well and docked on the Maestro Z platform as a media reference. For CytoView-Z 384 plates (Axion BioSystems), 50 µL volume was used for the fibronectin and media addition steps. Then, the CytoView-Z 384 plate was centrifuged for 2 minutes at 200 x g to eliminate bubbles.
Cancer cell lines were thawed and cultured in their respective media according to the supplier recommendations, passaging as needed. Cells were lifted from flasks and dissociated via trypsinization. The cell suspension was then transferred to a 15 mL conical tube and centrifuged at 1,000 rpm for five minutes. The supernatant was aspirated, being careful to not disturb the cell pellet. Cell density and viability were determined using a hemocytometer. Cells were resuspended and diluted in appropriate media to the desired working concentration. Cells were added at 100 µL per well, for a total well volume of 200 µL. For the CytoView-Z 384 plates, the cells were added in 25 µL per well, for a total well volume of 75 µL. Media alone was added edia Only Control wells.
The plate was allowed to rest at room temperature for one hour prior to docking on the Maestro Z, which incubated at 37°C and 5% CO2. Integrated humidity reservoirs on the CytoView-Z 96 or CytoView-Z 384 were filled with sterile water to maintain humidity.
Drug Dosing
SKOV3 cells were plated at 5,000 cells per well in a 96- well CytoView-Z plate, while A549 cells were plated at 2,500 cells per well in a 384-well CytoView-Z plate. Drugs (doxorubicin, mitoxantrone, 5-FU, paclitaxel, and cisplatin) were serially diluted from stock solutions in the appropiate cell media. At 24 hours post cell seeding, compounds were added at 10x the final concentration to treatment groups. Additional treatment groups included No Treatment Control (NTC), 0.1% DMSO as a ehicle Control , and 1% Triton X as a Full Lysis Control .
CAR T cell-mediated cytotoxicity assay
To measure CAR T cell-mediated killing, CAR T cells were thawed and cultured according to the supplier recommendations. CAR T cells were maintained in CAR T medium for at least 16 hours prior to addition. At approximately 24 hours post spheroid plating, CAR T cells were resuspended at 10x the desired final concentration, and then 22 µL of the cell suspension was added at various effector to target (E:T) ratios. The same volume of media was added to positive and negative controls groups. Triton X-100 (1%) was added to full lysis control wells.
Antibody-dependent cellular cytotoxicity (ADCC) assay
To measure ADCC killing, PBMCs were thawed and cultured according to the supplier recommendations. At approximately 20 hours post SKOV3 plating at 10,000 cells/well, Trastuzumab was added at several different concentrations (0.001 100 ug/ml) to appropriate wells. At 24 hours, CAR T cells were resuspended at 10x the desired final concentration, and then 22 µL of the cell suspension was added at 10:1 effector to target (E:T) ratio. NTC and Triton X were included as negative and positive controls.
Calculation of cytolysis
%Cytolysis was used to quantify cell death and was calculated using the following equation:
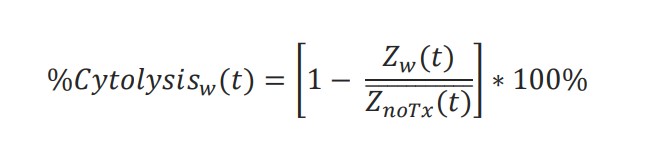
where 𝑍𝑛𝑜𝑇𝑥(𝑡) is a time series and the mean of the No Treatment control wells.
Generating dose response curves in AxIS Z
The Dose Response Analysis panel in AxIS Z allows the user to perform a best fit regression using a linear model or a Hill equation model. Dose response analysis may only be performed on treatment groups with 5 or more "Amounts" (e.g. doses) as defined in the Plate Map Setup module.
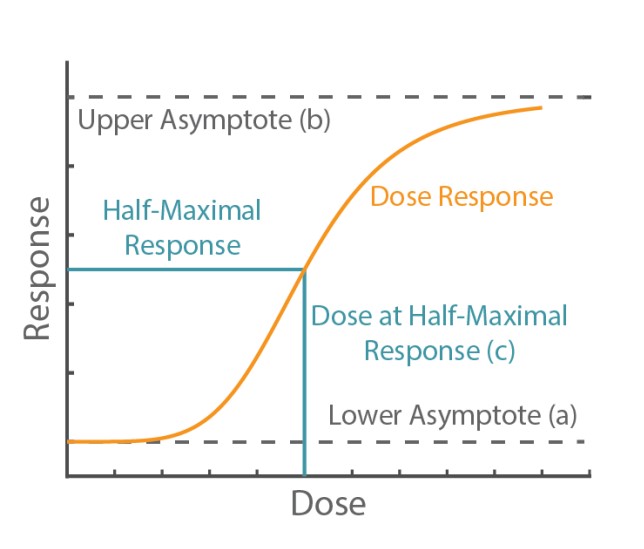
The Hill equation is a 4-parameter logistic model:
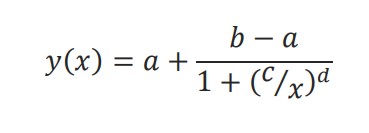
The physical interpretation of each parameter is illustrated in Figure 1. The lower (a) and upper (b) asymptotes define the minimum and maximum value of the best fit line, respectively. The dose at half-maximal response (c) is often referred to as the EC50 or IC50. Finally, the Hill slope (d) gives the slope at the steepest part of the curve.
Best Practices for Dose-Response Assays
Dose response analysis requires appropriate experimental design to be employed. Also, the reliability and sensitivity of dose response analysis can be optimized for a given assay by considering a few key details. Here we provide simple guidelines for performing dose response analysis with in vitro potency assays conducted on the Maestro Z platform. A Critical Step is required to perform dose response analysis in AxIS Z. An Opportunity for Optimization describes key assay decisions that can improve the reliability and sensitivity of dose response analysis.
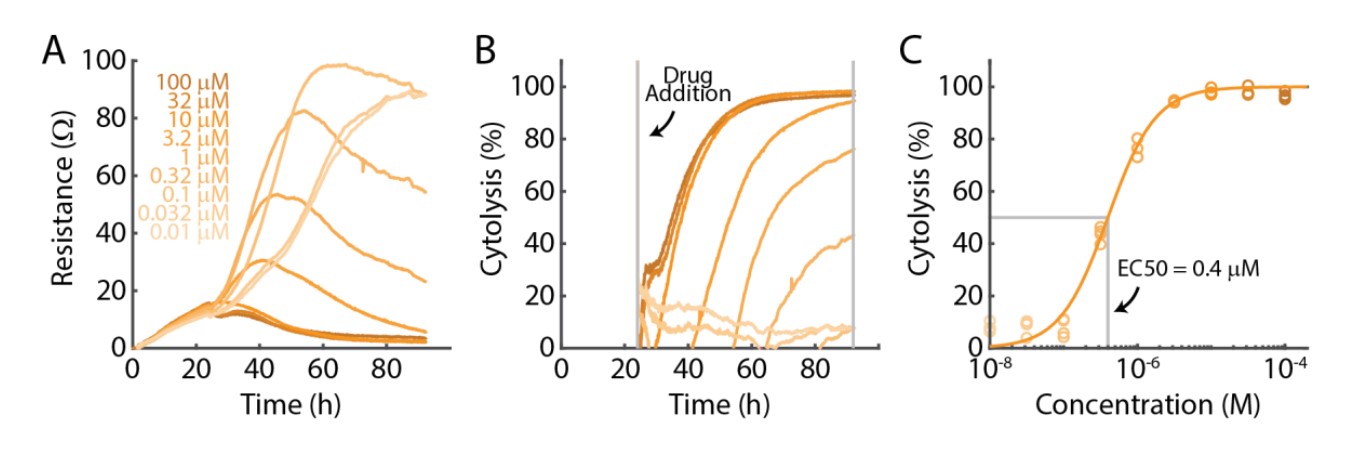
For each critical step or opportunity for optimization, we will reference an example experiment presented in Figure 2, in which SKOV3 cancer cells were treated with doxorubicin, a chemotherapeutic drug, at nine different concentrations. Doxorubicin killed the SKOV3 cells in a time- and dose-dependent manner, as illustrated by the resistance (Fig. 2A) and cytolysis (Fig. 2B) data acquired continuously throughout the experiment. The cytolysis at 96 hours was used for the dose response analysis, as presented in Figure 2C.
Critical Step: Select Appropriate Dosing Range
Determining the number, range, and spacing of the doses is a key step in evaluating the effect of a treatment. The Hill Equation (4 parameter logistic model) estimates 4 parameters, and thus requires a minimum of 5 concentrations to avoid over-fitting. In many cases, the assay response to a treatment may be better described on a logarithmic dose scale. Therefore, it is recommended that at least 5-10 concentrations be distributed across a broad dose range (e.g., half-log or full-log steps) for dose response analysis. Ideally, the highest concentration should exert the maximal effect and the lowest concentration should show little to no effect. In Figure 2C, the dose range spanned from ~0% to ~100% cytolysis, enabling a reliable Hill equation fit.
Opportunity for Optimization: Evaluate Dose Response across a Flexible Set of Endpoints
The Maestro Z allows for continuous, real-time measurements over the entire length of the assay and, thus, negates the need for collecting endpoint data. A dose-response curve can be generated at any time point during the assay from either the resistance data or the cytolysis data plot in AxIS Z. In Figure 2C, the 96 hour timepoint was used for dose-response analysis, but the analysis could be quickly and easily repeated at various other time points in the experiment.
Critical Step: Required Control Groups
An important step in generating accurate dose-response curve fits is ensuring the appropriate controls are included. As mentioned previously, IC50 and EC50 values are calculated at the halfway point between minimum and maximum responses. Therefore, it is critical to include doses that demonstrate no response and doses that induce a maximum response. Further, a No Treatment Control group is required for performing a Cytolysis dose response analysis.
Opportunity for Optimization: Parameter Constraints in the Curve Fit
AxIS Z allows for the user to constrain, or fix, the values of the lower and upper asymptote in the Hill equation, which can improve the fit performance in some cases. It is best practice to only constrain the asymptotes based on the physical constraints of the assay. For example, with cytolysis you may consider constraining the lower asymptote to 0% and the upper asymptote to 100% to signify no cell death and complete cell death, respectively. These settings can be particularly important if the dosing range does not span the full response range (e.g., no response to maximal response). For the analysis in Figure 2C, the lower and upper asymptotes in the Hill equation were fixed to 0% and 100% cytolysis, respectively.
Opportunity for Optimization: Choosing the Right Model
AxIS Z provides the option for a Hill equation fit or a linear fit. For most dose response analyses, the Hill equation fit will be the appropriate choice. However, in some assay development scenarios, such as developing a standard curve or selecting a cell density, a linear model may better describe the data.
Dose Response Case Studies
Case Study: High Throughput Screening
Dose response analysis is well-suited for 384-well plates and high throughput screening assays. Multiple treatments, with full dose response ranges, can be evaluated simultaneously on a single CytoView-Z 384- well plate, as illustrated by the data in Figure 3. A549 target cells were seeded across the plate and treated with five different compounds, each with an eight-point dose response.
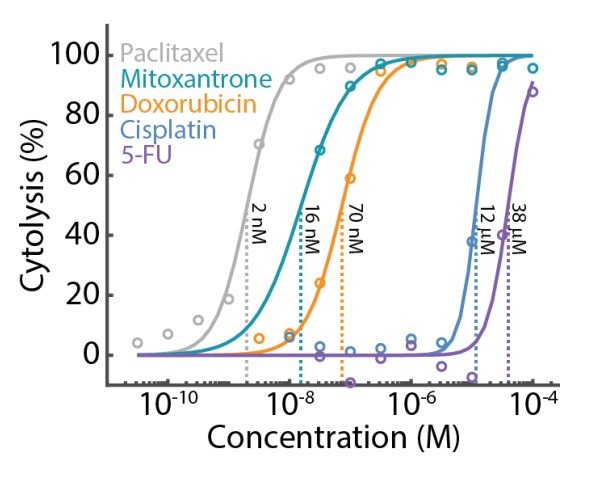
Cytolysis was computed relative to a "No Treatment Control" group (data not shown) and the dose response analysis was performed for each compound. To ensure consistency across the compounds, the lower and upper asymptotes of the Hill equation fit were constrained to 0% and 100% cytolysis, respectively. The results show that the A549 cells were most sensitive to paclitaxel (EC50 = 2nM) and least sensitive to 5-FU (EC50 = 38µM).
The CytoView-Z 384-well cytotoxicity assay enables high throughput dose response analysis for drugs or cell therapies. The high well count enables a wide dose regime across multiple orders of magnitude, ensuring a reliable estimate of the EC50.
Case Study: Potency Assays with 3D Models
The Maestro Z potency assay was used to compare CAR T cell-mediated cytolysis of SKOV3 spheroids and monolayer cultures with HER2-specific CAR T cells. The SKOV3 spheroids and monolayer cultures were seeded in a CytoView-Z plate and cytolysis was computed to monitor CAR T cell-mediated killing of the 2D and 3D tumor models (Fig. 4A). CAR T effector cells were added at five E:T ratios (1:10, 1:5, 1:2, 1:1, and 5:1) at 24 hours post-plating of the target cells. The monolayer groups (gray) had higher rates of cytolysis than their respective spheroid groups (orange) for the same E:T ratios. For example, the monolayer 5:1 group reached full lysis (100% cytolysis) faster than the spheroid 5:1 group.
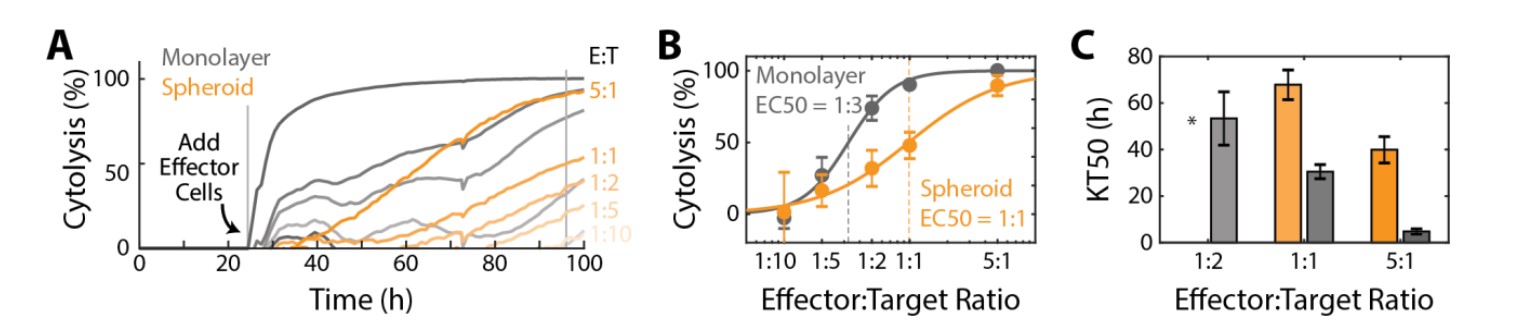
Cytolysis was compared at 72 hours post-addition of the CAR T effector cells (Fig. 4B) and potency was quantified via a dose response regression (see Methods). The EC50 E:T ratio of the HER2-specific CAR T cells was 1:3 for the monolayer target cells and 1:1 for the spheroid target cells. Also, the time required for the effector cells to kill 50% of the target cells (KT50), was significantly longer for the 3D model than the 2D model (Fig. 4C). Together, these results suggest a decreased potency of HER2-specific CAR T cells against a 3D tumor model in vitro.
Case Study: Antibody Dependent Cellular Cytotoxicity
Antibody dependent cellular cytotoxicity (ADCC) involves the use of monoclonal antibodies (mAbs) to recruit effector cells (e.g., Natural Killer (NK) cells) from the immune system to kill target cells. mAbs act as a bridge between the two cell types by binding to specific antigens located on target cells via their antigen-binding fragment (Fab) and interacting with effector cells via their fragment crystallizable region (Fc). These interactions help the effector cell trigger apoptosis in the target cell. Here, we used the well-known mAb, Trastuzumab, otherwise commercially known as Herceptin, which is specific to cancer cells that express HER2, such as SKOV3. We used the Maestro Z potency assay to evaluate the dose-dependent cytotoxicity of Trastuzumab in the presence of PBMCs, which include NK cells.
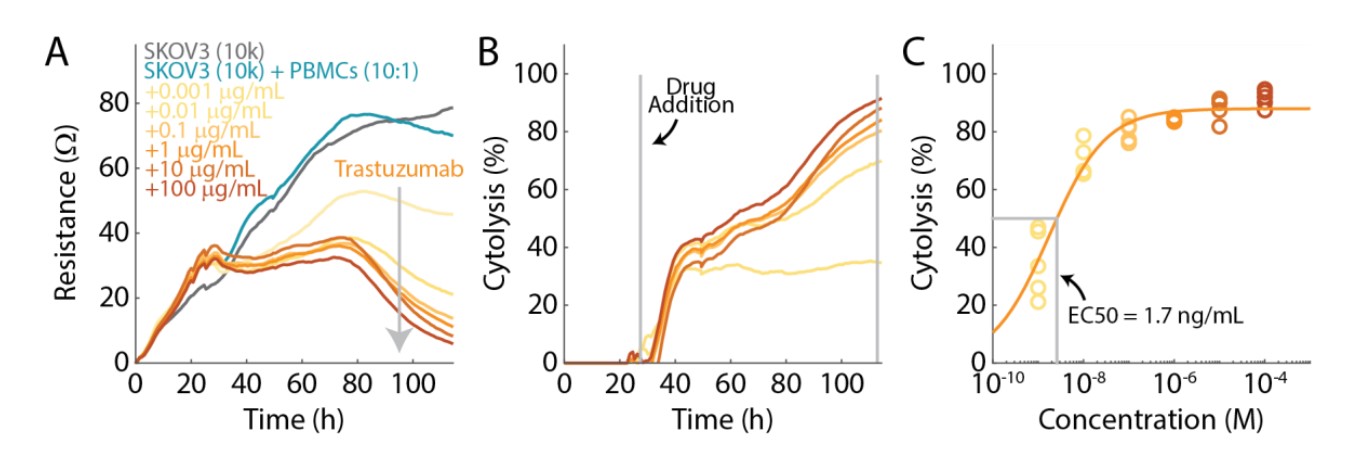
SKOV3 cells were seeded in a CytoView-Z plate and resistance was measured to monitor cell proliferation and death (Fig. 5A). Trastuzumab (0.001, 0.01, 0.1, 1,10, and 100 µg/ml) and PBMCs (E:T = 10:1) were added 24 hours after seeding the SKOV3 cells. As expected, increasing concentrations of Trastuzumab displayed a decrease in resistance relative to the PBMC treatment condition, alone (teal).
Cytolysis was computed using the PBMC treatment condition to isolate the specific cell death mediated by Trastuzumab (Fig. 5B). Cytolysis increased for higher concentrations of Trastuzumab. For example, SKOV3 cells treated with the higher concentrations (10 and 100 µg/mL) of Trastuzumab reached nearly 100% cytolysis after 90 hours, whereas the lowest concentration of Trastuzumab (0.001 µg/mL) only produced 34% cytolysis.
Cytolysis was analyzed at 90 hours after the addition of Trastuzumab and the PBMCs (Fig. 5C), and potency was quantified via dose response regression. The EC50 of Trastuzumab was 1.7 ng/mL.
Conclusion
The Maestro Z allows for simple, non-invasive, real-time monitoring of immune cell-mediated killing of target cancer cells, providing a sensitive, quantitative assay for evaluating immune cell potency in vitro. Built-in tools for dose response analysis streamline the evaluation of EC50/IC50 for comparison across treatment conditions or historical batch records. The case studies illustrate best practices for dose response analysis with drugs, therapeutic antibodies, and immune effector cells. Taken together, these results highlight the utility of the Maestro Z for potency assessment along the immunotherapy development pipeline.
References
- US FDA. "Potency Test for Cellular Gene Therapy Products." Guidance for Industry (2011)
- Hill, A.V. The possible effects of the aggregation of the molecules of haemoglobin on its dissociation curves." Journal of Physiology (1910).
- Gadagkar, S.R., and Call, G.B. "Computational tools for fitting the Hill equation to dose-response curves." Journal of Pharmacological and Toxicological Methods (2015).
Authors
Denise Sullivan, Parker Ellingson, Daniel Millard
Applications Department, Axion BioSystems, Atlanta, GA