Key Findings
>> The Maestro Z accurately and continuously measures immune cell-mediated killing over time
>> Differences in target cell density and proliferation can influence cytolysis magnitude and KT50
>> CAR T potency is antigen-specific and dependent on the expression of the target in the cancer cell line
Abstract
Cell-based therapies are a rapidly growing area of research with great promise. There is a critical need to develop in vitro potency assays that closely mimic complex interactions between immune cells and cancer cells and can accurately assess immune cell-mediated killing. In this study, we establish the Maestro Z for quantifying immune cell-mediated killing and provide examples of its unique capabilities. The influence of target cell culture conditions was evaluated using peripheral blood mononuclear cells (PBMCs) and specific killing was demonstrated with chimeric antigen receptor (CAR) T cells against different cancer cell lines.
Introduction
Immunotherapy harnesses the power of the innate and adaptive immune system in various ways to seek out and attack cancer. Current immunotherapeutic approaches include monoclonal antibodies that mark cancer cells for improved immune cell recognition and/or recruit immune cells to the site of malignancies, checkpoint inhibitors that interfere with specific pathways involved in cancer growth, oncolytic viruses that infect and kill cancer cells, and direct immune cell-mediated killing using chimeric antigen receptor (CAR) immune cells, bispecific T-cell engagers (BiTEs), tumor-infiltrating lymphocytes (TILs), and more.
The development of immunotherapies typically relies on the use of in vitro potency assays—which are key for understanding complex interactions between immune (effector) cells and cancer (target) cells—to evaluate the function, specificity, and sensitivity of a product. Although the goal of a potency assay is simply to evaluate the ability of a therapy to effect a given result when used in the intended manner (FDA, 2011), choosing an assay method that can accurately characterize a product and represent relevant mechanisms of action requires careful consideration.
For example, a variety of in vitro assays are used to characterize the proliferation, cytokine release, and cell-mediated cytotoxicity of engineered immune cells, such as CAR T cells, with each representing an important aspect driving clinical efficacy of the cellular product. Cytokine release assays characterize antigen recognition and proliferation assays assess the ability to expand rapidly upon antigen presentation. Ultimately, however, the desired effect of a CAR T cell is to mediate antigen-specific cytotoxicity of tumor cells. While an assay matrix may be useful for characterizing a cellular product, immune cell-mediated cytotoxicity provides the most direct method to assess potency.
Potency assays measure the ability of effector cells to kill target cells by either quantifying target cell viability (e.g., Alamar Blue, MTT, flow cytometry) or membrane integrity (e.g., LDH and chromium 51 release). However, many of these endpoint assays rely on the use of dyes or labels, are labor-intensive, and have limited ability to collect kinetic information.
In this study, we demonstrate a noninvasive immunotherapy potency assay using the Maestro Z, a platform that can continuously monitor cell-mediated killing and capture the cytolysis kinetics. The influences of target cell density and proliferation on the dynamics of cytolysis are compared using peripheral blood mononuclear cells (PBMCs), highlighting the importance of target cell culture conditions in a potency assay. The potency of HER2-targeted and mock CAR T cells is compared, as well as the impact of HER2 expression across cancer cell lines.
Materials and Methods
Cells and reagents
A549 (Cat. CCL-185), MCF7 (Cat. HTB-22), and SKOV3 (Cat. HTB-77) cells were obtained from ATCC (Manassas, VA). A549 media was composed of F12-K base media (Gibco, Cat. 1127022), 10% FBS (Gibco, Cat. 16000044), and 1% penicillin/streptomycin (Gibco, Cat. 15140122). MCF7 media was composed of Minimum Essential Medium (Gibco, Cat. 11095072), 10% FBS (Gibco, Cat. 16000044), 1% penicillin/streptomycin (Gibco, Cat. 15140122), and 0.01 mg/ml human recombinant insulin (Cat. 1258014). SKOV3 media was composed of McCoy’s 5A Medium Modified (ATCC, Cat. 30-2007), 10% FBS (Gibco, Cat. 16000044), and 1% penicillin/streptomycin (Gibco, Cat. 15140122).
Human PBMCs were obtained from Lonza (Basel, Switzerland). PBMC activation media was composed of LGM-3 lymphocyte growth media (Lonza, Cat. CC-3211), 10 ng/ml CD3 monoclonal antibody (OKT3; Thermo Fisher Scientific, Cat. 14-0037-82), and 100 U/ml human interleukin-2 (IL-2; Sigma, Cat. 10799068001). Donor-matched CAR T cells targeting HER2 (Cat. PM-CAR1024-1M), mock CAR T cells (Cat. PM-CAR1000-1M), non-transduced T cells (Cat. PM-CAR2003), and CAR T cell media (Cat. PM-CAR2001) were obtained from ProMAB Technologies (Richmond, CA).
Maestro Z assay platform
The Maestro Z platform (Axion BioSystems) uses impedance measurements (ohms, Ω) to quantify the presence of cells on electrodes embedded in the bottom of the wells of CytoView-Z plates (Axion BioSystems). Cellular impedance is a well-established technique for measuring cell attachment, spreading, proliferation, coupling, membrane integrity (cell death), and subtle changes in cell conformation. Detection is noninvasive and label-free, so it can quantify dynamic cellular responses over minutes, hours, and days. The Maestro Z’s built-in environmental controls finely control temperature and CO2, ensuring a consistent, optimal experimental environment.
PBMC-mediated cytotoxicity assay
To measure immune cell-mediated cytotoxicity with PBMCs, CytoView-Z 96 plates were first coated with 100 µL of fibronectin solution (1µg/mL) per well and incubated at 37°C and 5% CO2 for at least one hour. After incubation, excess surface coating was aspirated from each well. Then 100 µL of A549 medium was added per well and docked on the Maestro Z platform for a media reference measurement. A549 cancer cell lines were thawed and cultured according to the supplier recommendations, passaging as needed.
Cells were lifted from flasks and dissociated via trypsinization (Gibco, Cat. 15400054). The cell suspension was then transferred to a 15 mL conical tube and centrifuged at 1,000 rpm for five minutes. The supernatant was aspirated, being careful to not disturb the cell pellet. Cell density and viability were determined using a hemocytometer. A549 cells were resuspended and diluted in media to a working concentration of 20,000 or 100,000 cells/ml. Cells were added to the CytoView-Z 96 plate at 100 µL per well, for a total well volume of 200 µL. 100 µL of media was added to no treatment and media only control wells. The plate was allowed to rest at room temperature for one hour prior to docking on the Maestro Z, which incubated the plate at 37°C and 5% CO2. Integrated humidity reservoirs on the CytoView-Z 96 plate were filled with sterile water to maintain humidity.
PBMCs were thawed and cultured according to the supplier recommendations. A subset was activated with 10 ng/mL anti-CD3 and 100 U/mL IL-2 immediately prior to addition. Activated or non-activated PBMCs were added to the CytoView-Z 96 plate at effector to target (E:T) ratios of 5:1, 10:1, and 20:1 approximately 24 hours after target cell seeding in a 22 µL volume at 10x the desired final cell concentration. 1% TritonX-100 was added to full lysis control wells for 30 minutes at room temperature, then aspirated and replaced with 222 µL of cell media.
Alamar Blue viability assay
Cell viability was evaluated using a resazurin (Alamar Blue) viability assay. Briefly, cells were washed with PBS twice and then 110 µL of media composed of 10% resazurin dye was added. Cells were incubated with the resazurin/media solution for 45 minutes at 37°C and 5% CO2. After incubation, 100 µL of the resazurin/media solution was added to a clear 96-well cell culture plate. Fluorescence was read using a plate reader at 535 nm excitation and 595 nm emission wavelength.
CAR T cell-mediated cytotoxicity assay
To measure CAR T cell-mediated killing, CytoView-Z 96 plates were coated with 100 µL of fibronectin solution (1µg/mL) per well and incubated at 37°C and 5% CO2 for at least one hour. After incubation, excess surface coating was aspirated from each well. Then 100 µL of MCF7 or SKOV3 medium was added per well and docked on the Maestro Z platform for a media reference measurement.
MCF7 and SKOV3 cancer cell lines were thawed and cultured in their respective media according to the supplier recommendations, passaging as needed. Cells were lifted from flasks and dissociated via trypsinization (Gibco, Cat. 15400054). The cell suspension was then transferred to a 15 mL conical tube and centrifuged at 1,000 rpm for five minutes. The supernatant was aspirated, being careful to not disturb the cell pellet. Cell density and viability were determined using a hemocytometer. MCF7 cells were resuspended and diluted in MCF7 media to a working concentration of 150,000 cells/ml. SKOV3 cells were resuspended and diluted in SKOV3 media to a working concentration of 50,000 cells/ml. Cells were added to the CytoView-Z 96 plate at 100 µL per well, for a total well volume of 200 µL. 100 µL of media was added to no treatment and media only control wells. The plate was allowed to rest at room temperature for one hour prior to docking on the Maestro Z, which incubated the plate at 37°C and 5% CO2. Integrated humidity reservoirs on the CytoView-Z 96 were filled with sterile water to maintain humidity.
Effector cells (CAR T cells, mock CAR T cells, and non-transduced T cells) were thawed and cultured according to the supplier recommendations. CAR T cells, mock CAR T cells, and non-transduced T cells were maintained in CAR T medium for at least 16 hours prior to addition. Effector cells were resuspended at 10x the desired final cell concentration, and then 22 µL of effector cell suspension was added at various E:T ratios approximately 24 hours after target cell seeding. The same volume was added to positive and negative control groups. 1% TritonX-100 was added to full lysis control wells for 30 minutes at room temperature, then aspirated and replaced with 222 µL of cell media.
Calculation of cytolysis
%Cytolysis was used to quantify cell death and was calculated using the following equation:
Where:
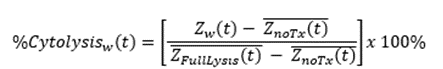
ZnoTx(t) is a time series and the mean of the no treatment control wells.
ZFullLysis(t) is a time series and the mean of the full lysis control wells.
%Cytolysis and kill time 50 (KT50) were calculated and exported using AxIS Z software.
Results
Maestro Z assay measures immune-cell mediated cytotoxicity
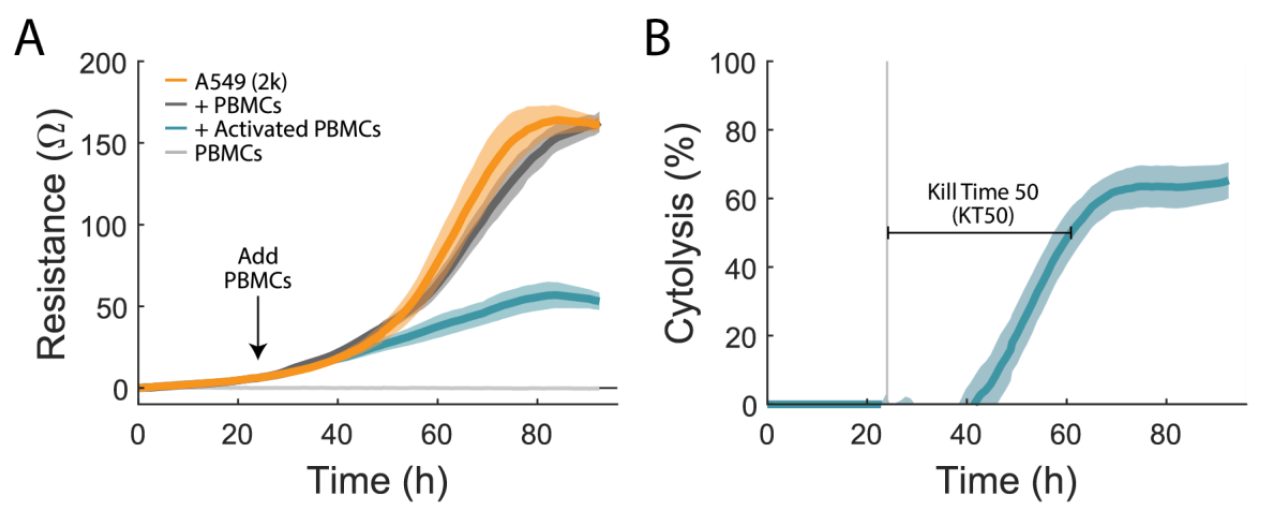
To quantify immune cell-mediated cytotoxicity, an A549 cancer line, a model for non-small cell lung cancer, was used. The attachment and proliferation of untreated A549 cells (Figure 1A, orange) were measured via the resistance over time as a negative control. At 24 hours, PBMCs were added at a ratio of 10:1. Activated PBMCs (teal) added to A549 wells greatly reduced resistance relative to the untreated controls, indicating immune cell-mediated cytotoxicity of A549 cells. 1% TritonX-100 was added to some untreated A549 wells as a full lysis control (not shown). PBMC only wells (light gray) and non-activated PBMCs (dark grey) were used to quantify the impact of PBMC addition on the resistance measurement. PBMC only wells had no significant signal, indicating that the measurement in this assay is specific to the target cells. Non-activated PBMCs (dark gray) added to A549 cells were virtually identical to A549 cells alone, indicating no cytotoxic effect.
The Maestro Z measures from the bottom of the well. It is sensitive to attached (or antibody-tethered) target cells, but not the presence of non-adherent immune effector cells. In this way, the assay is naturally sensitive and specific to target cell cytotoxicity, while minimizing background sometimes observed in other assays due to the presence of the effector cells.
We calculated the %cytolysis of the target cells, as described in the methods and illustrated in Figure 1B. Real-time measurement of cell-mediated cytotoxicity allowed for the calculation of kill time 50 (KT50), defined as the time required for 50% cytolysis of the target cells. For activated 10:1 PBMCs, KT50 was 39 ± 3 hours.
Target cell plating density and proliferation rates influence PBMC-mediated killing
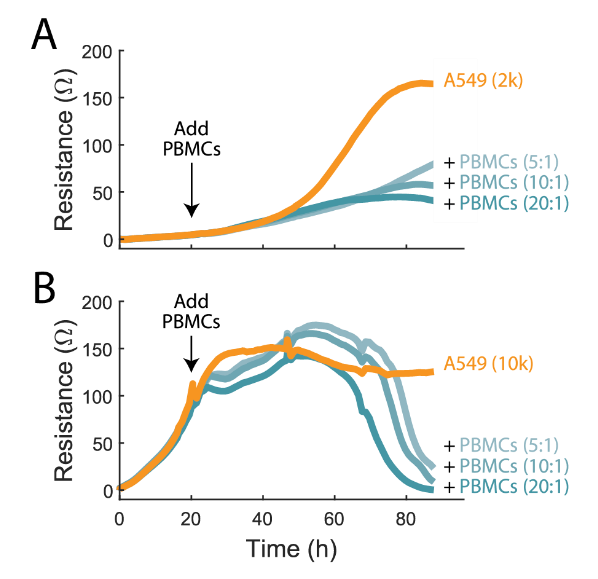
Cells nearing 100% confluency will often proliferate more slowly, and thus may be more susceptible to complete cell lysis. In contrast, cells that are in the log growth phase may be able to proliferate fast enough to delay complete cell lysis. It is important to monitor the entire course of cell lysis to understand the function of immunotherapy products and determine the best assay window for potency assessment.
To demonstrate this, A549 cells were plated at two different densities, 2,000 and 10,000 cells/well (2K and 10K, respectively). At 24 hours the 2K cells were still in the early growth phases while the 10k cells were nearly confluent. Activated PBMCs were added at E:T ratios of 5:1, 10:1, and 20:1. In the 2K condition, continued cell growth was observed but at a significantly slower rate in the presence of activated PBMCs, suggesting cell proliferation is outpacing cytolysis, though in a limited capacity (Figure 2A). Conversely, in the 10K condition, cytolysis is slower to initiate but reaches a greater maximum %cytolysis after about 70 hours post-addition (Figure 2B).
In both cases %cytolysis occurred in a dose-dependent manner, though the state of the target cell culture influenced the magnitude and kinetics of the immune-cell mediated killing observed. With continuous monitoring of the target cell culture by the Maestro Z, variations in the target cell culture and its role in cytotoxicity can be easily identified.
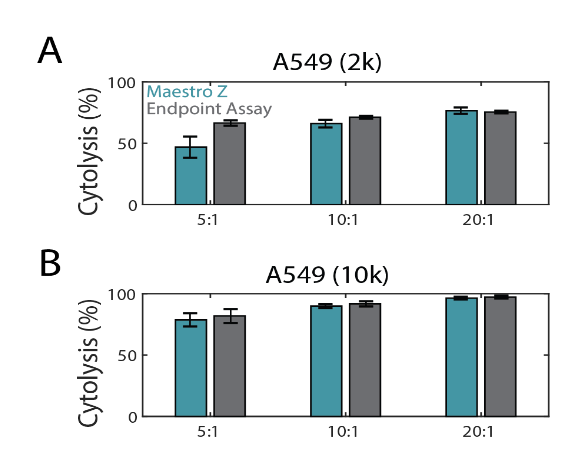
Maestro Z cytolysis metrics correspond to endpoint viability assay
In the same experiment as Figure 2, endpoint cell viability was assayed with Alamar Blue (resazurin) and compared to the Maestro Z. This endpoint assay is often used to assess cell proliferation and viability by adding resazurin dye to the cell media (Riss et al, 2016). The blue nonfluorescent resazurin dye is reduced by metabolically active cells to a pink and fluorescent state that can be measured with a spectrophotometer. Fluorescence data was used to calculate %cytolysis (see Methods). As shown in Figure 3A and 3B, both Maestro Z (teal) and the endpoint (gray) assay data showed similar dose-dependent %cytolysis results with increasing E:T ratios.
CAR T cells demonstrate antigen-specific killing
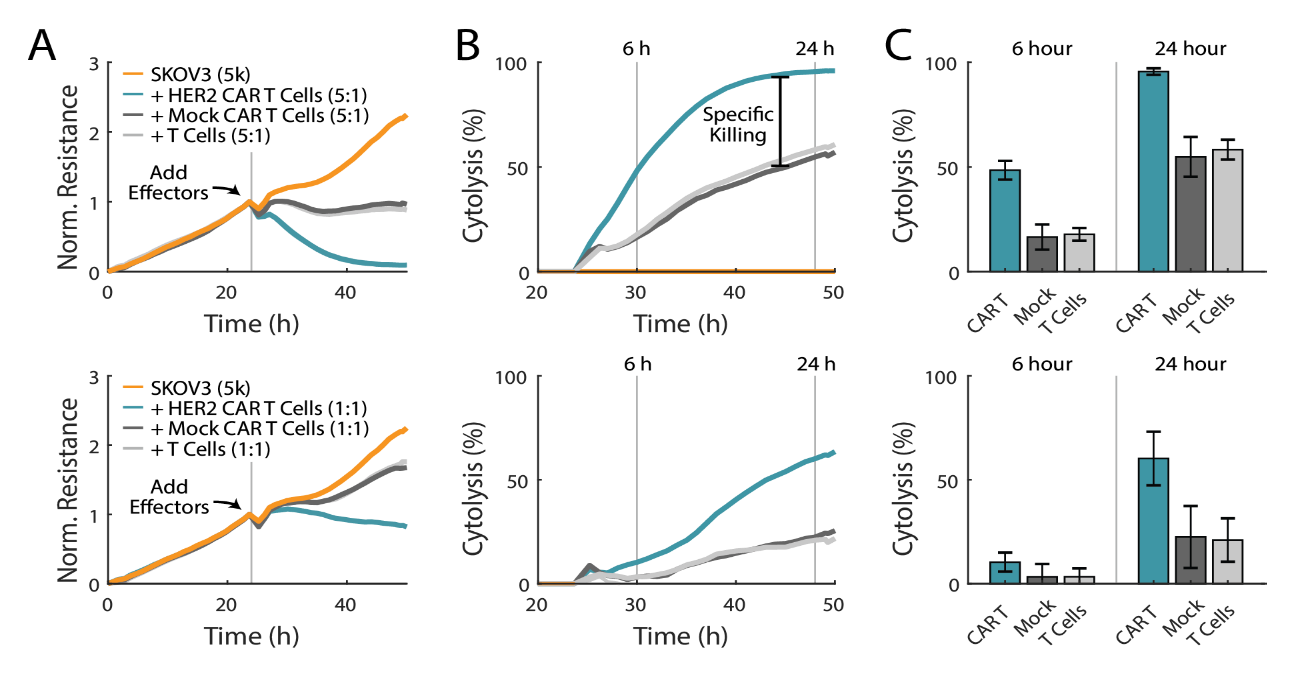
CAR T cell therapy uses genetically engineered T cells that express a chimeric antigen receptor composed of an intracellular domain from the signal activating regions for T cells and an extracellular domain that binds to a specific antigen on tumor cells (Jackson et al, 2016). The expression levels of the antigen on the target cell and the antigen receptor on the CAR T cell are both important when quantifying potency. In the HER2-overexpressing SKOV3 cell line, donor-matched mock CAR T cells, which lack the tumor antigen-recognizing domain, and non-transduced T cells were used to separate non-specific killing from specific CAR T-cell killing. As expected, SKOV3 cells treated with CAR T cells showed the greatest cytolysis, with near complete cell lysis in the 5:1 E:T group (Figure 4A, top). Mock CAR T cells and non-transduced T cells trended together, producing less cytolysis than CAR T cells at matching E:T ratios. As shown in Figure 4B and 4C, groups treated with CAR T cells showed approximately twice the amount of SKOV3 cytolysis at six and 24 hours, as compared to mock CAR T cells. 100% cytolysis was reached within 24 hours post-treatment with CAR T cells at a 5:1 E:T ratio. These results demonstrate that the Maestro Z can be used to differentiate between non-specific and specific killing of different effector cell types. Similar trends were observed for the 1:1 E:T ratio in Figure 4 A-C (bottom), with the CAR T cells again exhibiting significant antigen-specific killing.
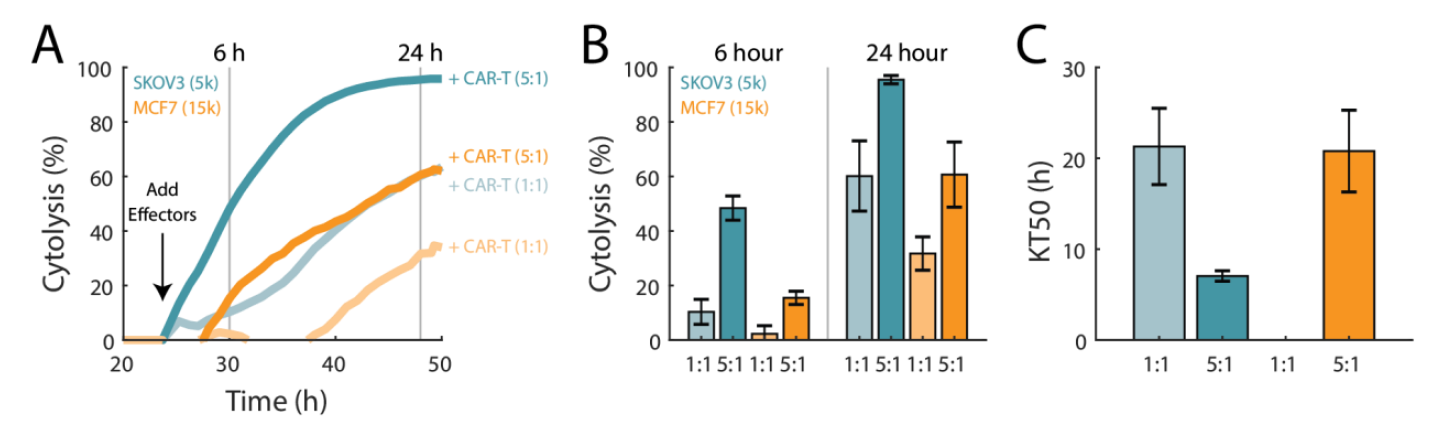
Antigen receptor levels have previously been shown to influence CAR T cytolytic activity (Anikeeva et al, 2021). To demonstrate this, CAR T cells targeting HER2 were used to compare the in vitro killing of HER2-expressing and overexpressing cancer cell lines, MCF7 and SKOV3, respectively (Subik et al, 2010).
As shown in Figure 5, when CAR T cells targeting HER2 were added to MCF7 cells, CAR T cells showed a greater %cytolysis at both E:T ratios for SKOV3 cells when compared to MCF7 cells. Furthermore, SKOV3 cells treated with CAR T cells at 1:1 E:T took approximately the same time to reach KT50 as MCF7 cells treated with CAR T cells at the higher E:T ratio of 5:1 (21.3±4.2 vs 21.8±4.5, respectively).
Conclusion
The Maestro Z allows for simple, non-invasive, real-time monitoring of immune cell-mediated killing of target cancer cells, providing a sensitive, quantitative assay for evaluating immune cell potency in vitro. Continuous monitoring of target cell attachment and proliferation enabled the evaluation target cell culture conditions on PBMC-mediated cell killing. Specific CAR T cell-mediated killing was demonstrated against different target cancer cell lines and across different E:T ratios, illustrating the importance of target antigen selection.
By applying the same principles demonstrated in this assay, the in vitro potency of other types of immunotherapies, such as oncolytic viruses, monoclonal antibody treatments, or immune checkpoint modulators may be evaluated.
References
- US FDA. “Potency Tests for Cellular and Gene Therapy Products.” Guidance for Industry (2011).
- Riss et al. "Cell viability assays." Assay Guidance Manual (2016).
- Jackson et al. “Driving CAR T-cells forward”. Nat. Rev. Clin. Oncol. (2016).
- Lattrich et al. “Detection of an elevated HER2 expression in MCF-7 breast cancer cells overexpressing estrogen receptor beta1”. Oncol Rep. (2008).
- Subik et al. "The expression patterns of ER, PR, HER2, CK5/6, EGFR, Ki-67 and AR by immunohistochemical analysis in breast cancer cell lines". Breast cancer: basic and clinical research (2010).
- Anikeeva et al. “Efficient killing of tumor cells by CAR-T cells requires greater number of engaged CARs than TCRs”. J. Biol. Chem. (2021).
Authors
Denise Sullivan, MS and Daniel Millard, PhD
Applications Department, Axion BioSystems, Atlanta, GA