Key Findings
>> Cell density, time course, and media type affect in vitro neuronal activity progression
>> Optimization of measurement parameters is important to accurately capture compound effects
>> A well-tuned neural assay on the Maestro Pro can be used to detect a wide variety of neuroactive compound effects
Abstract
In vitro neuronal models are valuable tools for studying brain function, neural diseases, and toxicology. In vitro assays using these models may require optimization to detect experimental effects accurately and consistently. Here, we prescribe steps for optimizing the cell model and measurement protocol on the Maestro Pro to improve the characterization of responses to neuroactive compounds in vitro.
Introduction
The complexity and difficulty of measuring signals from the brain make the in vivo study of neurological disorders, as well as toxicological drug testing, laborious and costly processes. In vitro neural cultures provide an alternative to in vivo studies and allow for high throughput analysis of neurological disease states and neurotoxic and seizurogenic assessment of drugs1. The advent of high throughput microelectrode arrays (MEAs) has allowed for rapid, label-free assessment of the electrophysiology of these in vitro cultures. MEAs provide functional readouts that can be used to characterize changes in in vitro neural cultures due to experimental conditions, such as following dosing with neuroactive compounds. It is therefore important to develop assay conditions that produce accurate, consistent, and reproducible results.
Here, we discuss steps that can be taken to optimize both the cellular model and measurement parameters of an in vitro neural assay. Using primary rat cortical neurons (RCNs) as a test case, we examine the effect of cell density, time course, and culture media on the progression of neural activity. The desired parameters for a given neural assay will be application-dependent, such as detection of inhibitory or excitatory neuroactive compounds. We dosed RCN cultures with an excitatory compound, 4-AP, to refine parameters such as recording length and compound incubation time that ensure detection of 4-AP effects and accurately reflect the culture’s response. We then detected the effects of known inhibitory, excitatory, and anti-psychotic neural drugs. In total, this technical note provides a guide for optimizing an in vitro MEA assay to enhance assay sensitivity and lead to accurate detection of neuroactive compound effects.
Materials and Methods
Cells and reagents
Primary rat cortex neurons, RCN, (Cat. A1084002) were obtained from ThermoFisher (Waltham, MA). RCN media was composed of one of the following:
BrainPhys + SM1: BrainPhysTM Neuronal Medium (STEMCELL Technologies, Cat. 05790) and 2% NeuroCultTM SM1 Neuronal Supplement (STEMCELL Technologies, Cat. 05711) with 1% penicillin/streptomycin (Gibco, Cat. 15140122).
NeuroBasal Plus + B27 Plus: Neurobasal Plus Medium (Gibco, Cat. A3582901), 0.25% Glutamax (Gibco, Cat. 35050061), 2% B-27 Plus Supplement (Gibco, Cat. A3582801), and 0.1% gentamicin (Gibco, Cat. 15710064).
NeuroBasal + B27: Neurobasal Medium (Gibco, Cat. 21103049), 0.25% Glutamax (Gibco, Cat. 35050061), 2% B-27 Supplement (Gibco, Cat. 17504044), and 0.1% gentamicin (Gibco, Cat. 15710064).
All drugs were purchased from Cayman Chemicals unless otherwise stated. 4- aminopyridine was obtained from Sigma Aldrich.
Cell plating
CytoView MEA 24-well or 48-well plates were spotted with a 5 µL droplet of Poly-D-Lysine, PDL, (Gibco, Cat. A3890401) over the microelectrode array in each well. After 1 hour incubation at 37°C and 5% CO2, each well was washed with diH20 four times to remove any excess PDL and allowed to dry overnight in the biosafety cabinet. Then, RCNs were thawed according to supplier recommendations. Next, the cell suspension was transferred to a 15 mL conical tube and centrifuged at 300 x g for 5 minutes. The supernatant was aspirated, being careful not to disturb the cell pellet. Cell density and viability were determined using a hemocytometer. For density sweep experiments, cells were resuspended and diluted in appropriate media to the desired working concentration in the range of 1,000,000 neurons/mL – 16,000,000 neurons/mL, depending on the desired density. For all other experiments, the cell solution was diluted to a working concentration of 8,000,000 neurons/mL. Cells were then spotted over the array in a 5 µL droplet for each well and the plate was incubated at 37°C and 5% CO2 for 1 hour. Finally, additional media (500 µL) was added. Integrated humidity reservoirs on the CytoView MEA 24 were filled with sterile water to maintain humidity. Every 2-3 days during culture, 50% of the RCN media was replaced.
Drug dosing
At DIV14, neurons were dosed with the following compounds and concentrations: 100 µM 4- aminopyridine (4-AP), 50 µM bicuculine, 5 µM SNC80, 5 µM mefloquine, 1 µM amitriptyline, 1 µM haloperidol, and 10 µM Aripiprazole. All compounds were diluted from a stock solution in RCN media and were added at 10x the final concentration to treatment groups. Additional treatment groups included no treatment control (NTC) and 0.1% DMSO as a vehicle control. A 5- minute recording was taken prior to dosing and served as the baseline measurement. To test different recording lengths, a 10-minute baseline recording was taken and cut into smaller segments for comparison. After drug dosing, the plate was incubated for 1 hour in a 37°C incubator before another 5-minute “dosed” recording was taken. To test drug incubation time, recordings were taken at 30 minutes, 1 hour, 2 hours, 4 hours, and 24 hours after dosing.
Following the dosed recording, the drug was washed out by performing a full media change on all wells. The plate was returned to the incubator, and the cells were maintained as normal.
Neural activity recording and analysis with the Maestro MEA platform
The Neural Spontaneous + Viability configuration in AxIS Navigator was used to record resistance (cell viability) and electrical activity from all electrodes in each well using a Maestro Pro. To record, plates were pulled from the incubator, placed in the Maestro Pro, and allowed to equilibrate for 5 minutes. Recordings were taken at DIV7, at DIV14 (both pre-and post-drug dosing), and DIV21. Spikes were detected using AxIS Navigator with a threshold of 6 standard deviations above the noise. Neural data was analyzed using the Neural Metric Tool where electrodes were considered active if they had a minimum of 5 spikes per minute. Single bursts were detected as single electrodes where 5 spikes occurred with a maximum inter-spike interval (ISI) of 100 ms. Network bursts were detected using the “Adaptive” algorithm in the Neural Metric Tool, with the minimum number of spikes set to 50, the maximum ISI set to 100 ms, and the minimum electrode percentage set to 35%. The synchrony window was set to 20 ms. The recommended endpoint metrics were then exported from the Neural Metric Tool and visualized using the AxIS Metric Plotting Tool. Mean firing rate, area under the normalized cross-correlation, interspike interval coefficient of variation, and resistance were chosen as metrics representative of culture activity, synchrony, tendency towards oscillation, and cell viability respectively.
Optimizing a cellular model
Density sweep
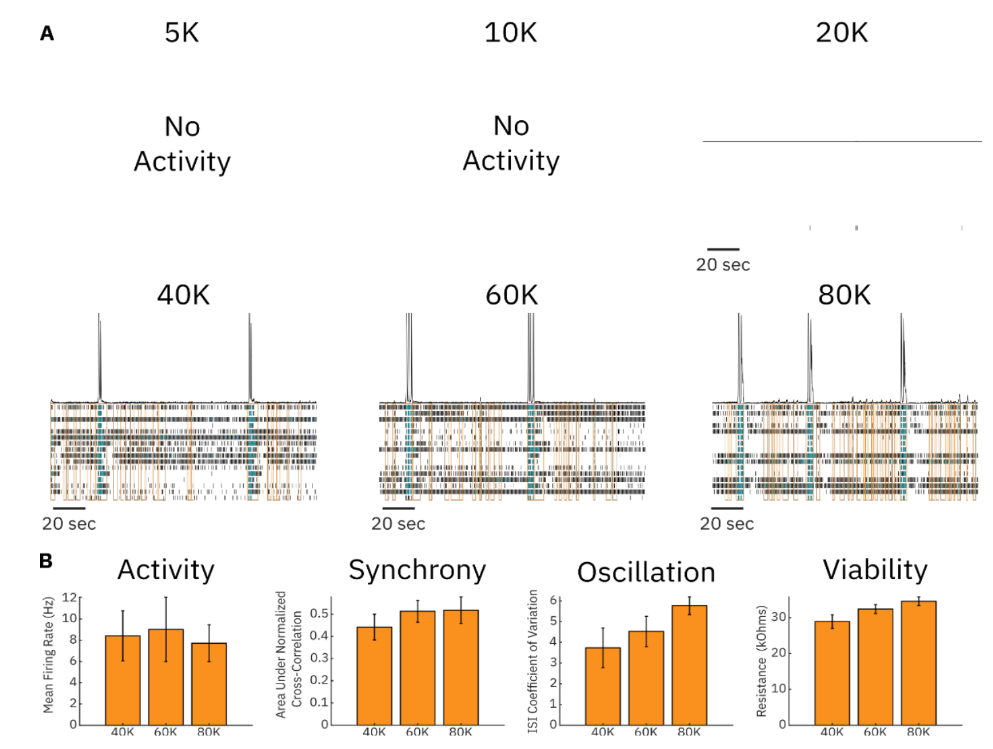
The density of neurons that make up an in vitro culture can greatly affect the electrophysiological characteristics of the network. Cultures that are too sparse may not sufficiently cover the electrodes of the MEA or may not make a large enough number of connections with surrounding cells to produce a robust neural network. Cultures that are too dense may lead to cell detachment due to contact inhibition or may require unnecessarily large numbers of cells to run a given assay. Therefore, we measured the electrical activity of cultures consisting of six different cell densities: 5,000 cells/well, 10,000 cells/well, 20,000 cells/well, 40,000 cells/well, 60,000 cells/well, and 80,000 cells/well. At cell densities ≤20,000 cells/well, little-to-no neural activity was measured in the culture. In contrast, in densities ≥40,000 cells/well, robust spiking activity was observed (Figure 1A). We quantified electrophysiological metrics for the three highest cell densities that had sufficient spiking activity. Activity levels were similar between the three highest cell densities, while synchrony, oscillations, and viability increased in a density-dependent manner. In this case, 40,000 was the minimum number of cells that produced consistent, robust, and detectable spiking across wells. Other cell models may require more or fewer cells per well, as well as other supporting cell types.
Time of dosing
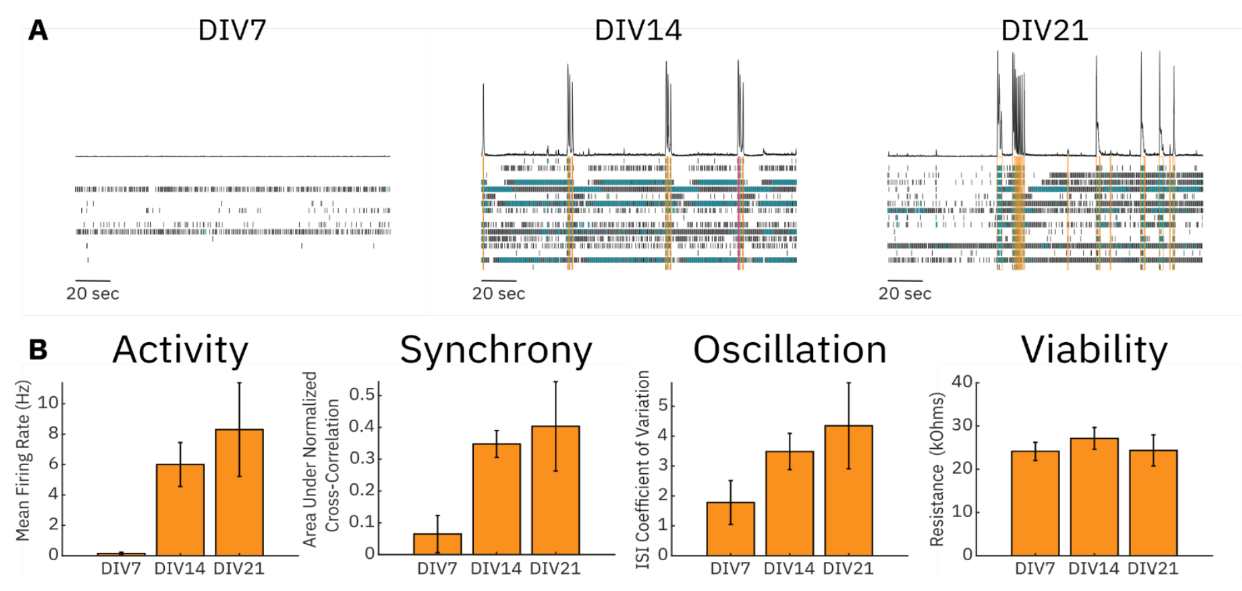
After plating, neuronal cultures may require an extended period to recover from the thawing process following cryopreservation. During this period, the neurons must adhere to the culture surface, spread over the MEA substrate, and form cell-to-cell contacts that will help create an in vitro neural network. Therefore, it is important to understand the progression of this network formation and to find at what point the culture is ready to be used in an assay. A moderate amount of spiking activity in the culture is desirable so that both increases and decreases can be detected. To this end, we monitored the activity, synchrony, oscillations, and viability of an RCN culture over 21 days (Figure 2). At DIV7 in culture, very little activity was detected in cultures, and from this point, all electrophysiological metrics increased over the 21-day time course. DIV14 exhibited a moderate level of activity, synchrony, and oscillations. Importantly, the variability in the culture increased at DIV21 compared to DIV14 as evidenced by the increased standard deviation in our chosen metrics. Viability remained unchanged throughout the time course, highlighting that these network characteristics were not the result of cell death or growth.
Media composition
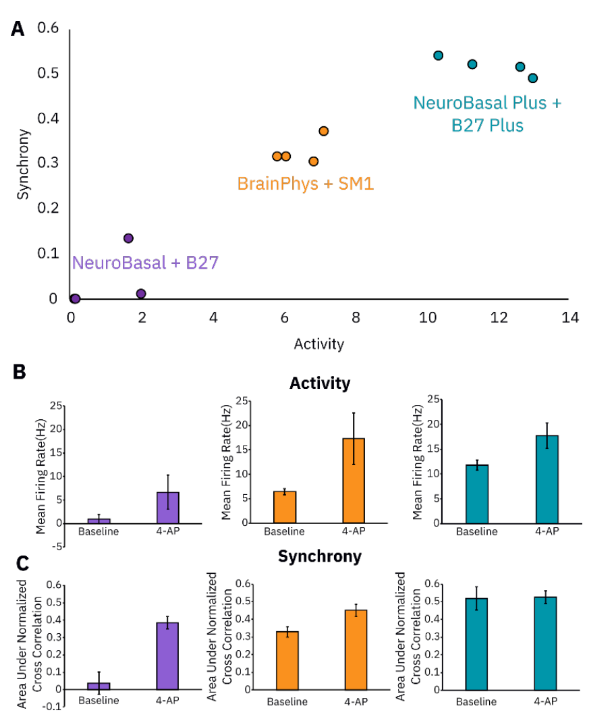
Similarly to cell density and time course, media composition can alter the electrophysiological phenotype of neurons in in vitro cultures and, therefore, should be considered when designing a neural assay. Certain media types are designed to induce highly synchronous cultures while others may lead to more unorganized firing patterns. The desired media type will be dependent on the application or assay being used. We therefore investigated the effect of three different media types on in vitro neuronal activity: NeuroBasalTM + B-27TM, NeuroBasalTM Plus and B-27TM, and BrainPhysTM + NeuroCultTM SM1. As shown in Figure 3 using NeuroBasalTM Plus and B-27TM Plus media resulted in highly synchronous and active cultures, while NeuroBasalTM + B-27TM media resulted in cultures with drastically less activity, synchrony, and oscillations. BrainPhysTM + NeuroCultTM SM1 led to a moderate level of baseline neural activity for each measure, allowing for the detection of either increases or decreases in all three parameters following compound dosing. An example with an excitatory compound, 4-AP, is shown in Figures 3B and 3C. Increases in activity and synchrony were detectable in cultures with NeuroBasal + B27 and BrainPhys + SM1. However, the baseline levels of activity and synchrony of NeuroBasal + B27 were near zero. In contrast, the NeuroBasal Plus + B27 Plus media condition yielded a more modest increase in activity but no detectable increase in synchrony as the baseline synchrony values were already very large. In total, media conditions as well as cell density and time course can greatly affect in vitro neural activity and should be taken into consideration when designing a neural assay on the Maestro MEA system.
Recording considerations
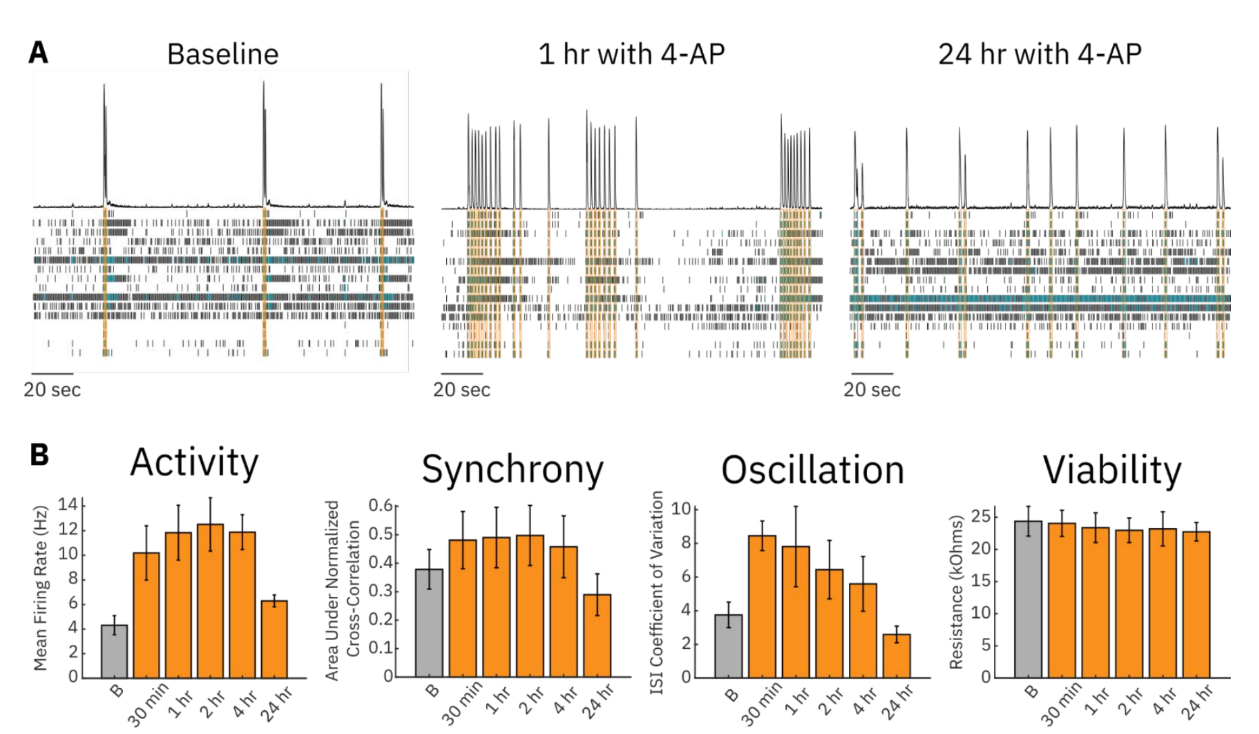
Drug incubation time
When dosing with neuroactive compounds, it is important to consider the mechanism of action and resulting kinetics of the compounds being tested. Understanding the time it takes for the compound to exert its maximal effect will inform how long to incubate the neural culture with the compound and when to measure the response. To demonstrate this principle, we dosed neural cultures with the potassium channel blocker 4- AP and measured the neural culture’s response at 30 minutes, 1 hour, 2 hours, 4 hours, and 24 hours post-dose. As shown in Figure 4, 4-AP generally increased activity, synchrony, and oscillations post-dose, while culture viability remained the same. Our results showed that maximal effect on activity and synchrony occurred around 2 hrs post-dose, although all drug incubation times other than 24 hrs produced similar results. Increases in oscillations peaked at 30 minutes post-dose and steadily decreased thereafter. Importantly, at 24 hours-post dose, the neural culture’s activity, synchrony, and oscillations had returned to near baseline levels (Figure 4B) and the pattern of neural spiking no longer resembled the dosed phenotype (Figure 4A). Other slower-acting compounds may necessitate longer drug incubation times to accurately capture changes in neural activity. Similarly, some drugs may have extremely acute effects that will require recording immediately following dosing. These parameters should be optimized for each compound-cell model combination.
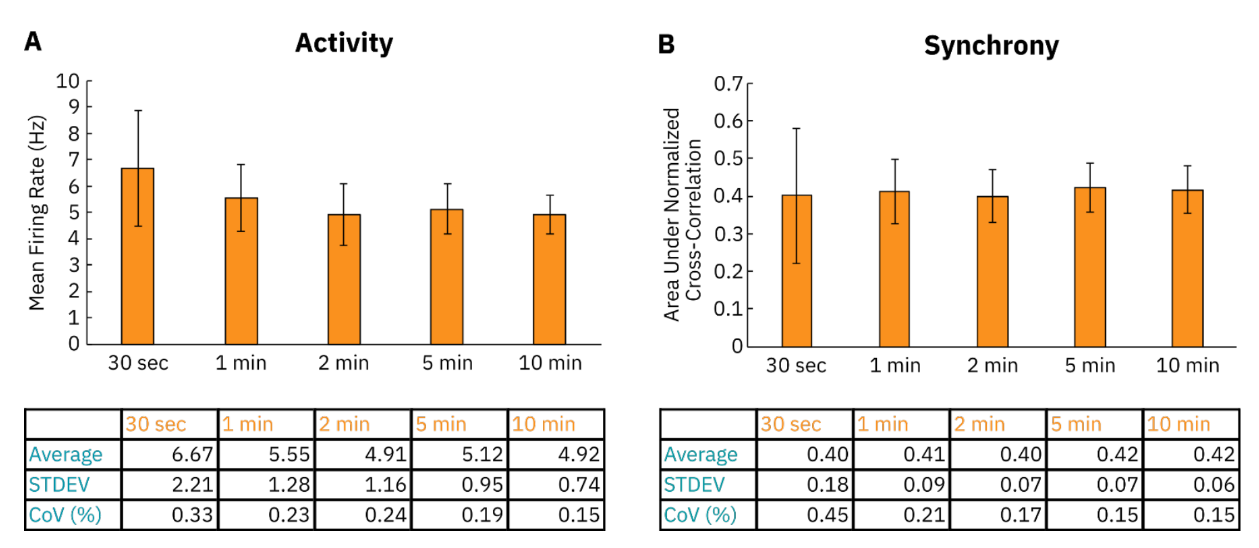
Length of recording
Another important consideration when recording neural activity on the Maestro MEA system is the length of the recording that is being taken. A recording that is too short may not be sufficient to capture changes in neural activity or to observe events that happen on larger time scales. Recordings that are too long may not be necessary to accurately represent the neural culture’s phenotype and may lead to the storage of unnecessarily large data files. To illustrate this, we gathered a 10-minute recording of baseline in vitro RCN activity and measured the variation of differently sized file segments. As shown in Figure 5, the coefficient of variation (CoV) and standard deviation of activity (mean firing rate) and synchrony (area under the normalized cross-correlation, AUNCC) measurements generally increased as the recording length shortened. A failure to capture events such as network bursts that happen later in the recording can lead to a large CoV of shorter recordings. Although the average (mean) for AUNCC was similar across all recording lengths, the average mean firing rate was measured to be higher (6.67 Hz) sufficient data to accurately represent the culture’s activity.
A compound dosing case study
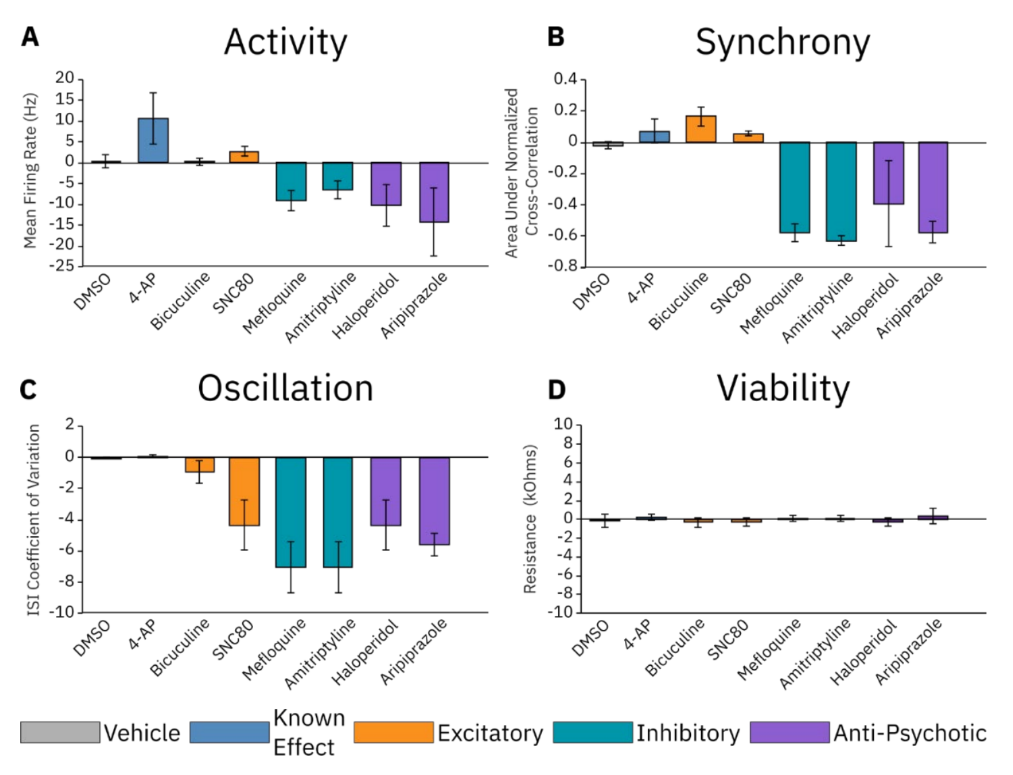
Excitatory, inhibitory, and anti-psychotic drug dosing
All the previously described steps are important to consider when designing a good in vitro neural assay. To showcase the sensitivity of an assay optimized through these steps, we dosed RCNs with compounds from the following classes: excitatory, inhibitory, and anti-psychotic (Figure 6). We also included a DMSO negative control and 4-AP as a neuroactive compound with a known effect. We found that, although no change in activity was detected, the excitatory compound bicuculine induced an increase in synchrony following dosing. Another excitatory compound, SNC80, induced increases in both activity and synchrony, although it increased synchrony less compared to bicuculine. Both excitatory compounds led to decreases in oscillations in culture. The inhibitory compounds mefloquine and amitriptyline led to decreases in all three metrics, as did the anti-psychotic compounds haloperidol and aripiprazole. These results are consistent with those previously reported in the literature1, 2, 3.
Conclusion
In vitro neural assays using MEA technology are powerful tools for studying neuroscience and measuring neural cultures’ electrophysiological responses to pharmacologic agents. However, with a wide variety of cellular models and neuroactive compounds available to researchers, in vitro neural assays require sufficient optimization to measure pharmacologic responses accurately and consistently. Here, we demonstrated several steps that may be taken to optimize both the cellular model being used and the methodology for recording changes in neural activity on the Maestro Pro MEA system. Following these best practices produced an assay that was sensitive to the effects of several different neuroactive compounds with different mechanisms of action. The best practices prescribed here can be used for other cellular models and applications and can be used to ensure accurate, consistent measurement of in vitro neural cultures on the Maestro platform.
References
1. Bradley, J.A., Luithardt, H.H., Metea, M.R., and Strock, C.J. (2018). In Vitro Screening for Seizure Liability Using Microelectrode Array Technology. Toxicol. Sci. 163, 240–253. https://doi.org/10.1093/toxsci/kfy029.
2. Görtz, P., Henning, U., Theiss, S., and Lange-Asschenfeldt, C. (2019). Effect fingerprints of antipsychotic drugs on neural networks in vitro. J. Neural Transm. 126, 1363–1371. https://doi.org/10.1007/s00702-019-02050-8.
3. Kosnik, M.B., Strickland, J.D., Marvel, S.W., Wallis, D.J., Wallace, K., Richard, A.M., Reif, D.M., and Shafer, T.J. (2020). Concentration–response evaluation of ToxCast compounds for multivariate activity patterns of neural network function. Arch. Toxicol. 94, 469–484. https://doi.org/10.1007/s00204-019-02636-x.
Authors
Benjamin Streeter, Senior Scientist
Denise Sullivan, Senior Applications Manager
Daniel Millard, VP of R&D - Bioelectronics
Axion BioSystems, Atlanta, GA