Key Findings
>> The Maestro Pro can characterize three hallmark parameters of neural electrophysiology: activity, synchrony, and oscillation.
>> Rodent cortical neuron cultures develop increased activity, synchrony, and oscillations over time.
>> Changes in neural activity in response to neuroactive compounds are easily detectable using the Maestro Pro.
Abstract
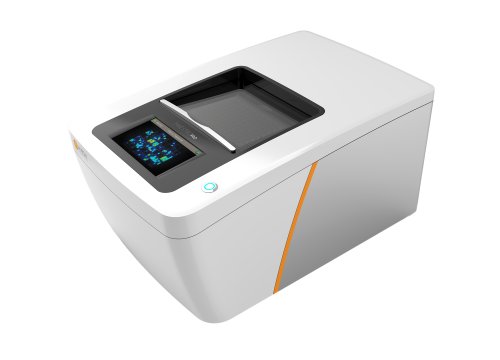
In vitro neuronal models are valuable tools for studying brain function, neural diseases, and toxicology. With the use of microelectrode arrays (MEAs), the Maestro Pro™ can measure the electrical activity of neural cultures in a high-throughput manner and provide quantifiable endpoints as descriptors of the neural network. Here, we demonstrate the Maestro Pro’s ability to characterize both baseline neural activity and the response to neuroactive compounds of an in vitro neuronal model.
Introduction
The complexity and difficulty of measuring signals from the brain make the in vivo study of neurological disorders, as well as toxicological drug testing, laborious and costly processes. In vitro neural cultures provide an alternative to in vivo studies and allow for high-throughput analysis of neurological disease states and neurotoxic and seizurogenic assessment of drugs (Bradley et al., 2018). However, assays often used to evaluate neurotoxicity in vitro rely on analysis of biochemical pathways or cellular morphology and may involve laborious fluorescent staining techniques (Negri et al., 2020). These methods are also often endpoint assays, and the resulting data is collected from a single time point that may not accurately capture the kinetics of the drug being evaluated. Importantly, changes in electrophysiology may precede morphological and biochemical signaling changes and may provide information about disruption of the neural cultures or changes in ion channel function that otherwise would not be detectable using conventional molecular assay methods (McConnell et al., 2012). The use of multi-well microelectrode arrays (MEAs) enables the measurement of electrophysiological signals from neural cultures in vitro and, consequently, changes in the electrophysiological phenotype of these cultures following exposure to neuroactive compounds. Multi-well MEAs can be used to make high throughput measurements that do not destroy or disrupt the neural cultures within the well. Therefore, functional activity may be monitored throughout the duration of the cultures, including before and after treatment addition.
Here, we demonstrate the use of the Maestro Pro MEA system for measuring the development of neural activity over time in a culture of rat cortical neurons, as well as the response of these cultures to dosing with four different neuroactive compounds. We optimized the neural culture activity to detect neuroactive compounds via careful consideration of cell type, cell density, media system, and dosing schedule. In total, our results illustrate that the Maestro Pro is an excellent tool for monitoring in vitro neural activity and detecting electrophysiological changes induced by compound dosing.
Materials and Methods
Cells and reagents
Primary rat cortex neurons, RCN, (Cat. A1084002) were obtained from ThermoFisher. RCN media was composed of BrainPhys™ Neuronal Medium (STEMCELL Technologies, Cat. 05790) and 2% NeuroCult™ SM1 Neuronal Supplement (STEMCELL Technologies, Cat. 05711) with 1% penicillin/ streptomycin (Gibco, Cat. 15140122).
Picrotoxin (Cat. P1675), Carbachol (Cat. C4382), Glutamate (Cat. 49621), 4-aminopyridine (Cat. 275875), and dimethyl sulfoxide (DMSO) were obtained from Sigma-Aldrich.
Cell plating
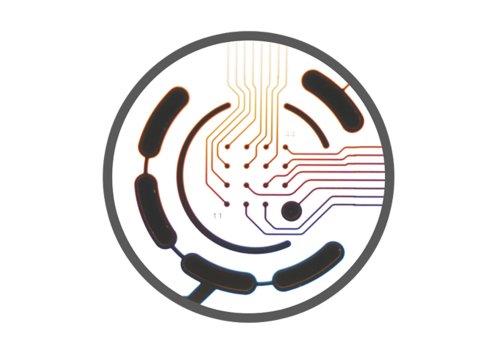
CytoView MEA 24-well plates were spotted with a 5 µL droplet of Poly-D-Lysine, PDL, (Gibco, Cat. A3890401) over the microelectrode array in each well. After 1 hour incubation at 37°C and 5% CO2, each well was washed with diH20 four times to remove any excess PDL and allowed to dry overnight in the biosafety cabinet. Then, RCNs were thawed according to supplier recommendations. Next, the cell suspension was transferred to a 15 mL conical tube and centrifuged at 300 x g for 5 minutes. The supernatant was aspirated, being careful not to disturb the cell pellet. Cell density and viability were determined using a hemocytometer. Cells were resuspended and diluted in appropriate media to the desired working concentration of 8,000,000 neurons/mL. Cells were then spotted over the array in a 5 µL droplet for each well and the plate was incubated at 37°C and 5% CO2 for 1 hour. Finally, additional media (500 µL) was added. Integrated humidity reservoirs on the CytoView MEA 24 were filled with sterile water to maintain humidity. Every 2-3 days during culture, 50% of the RCN media was replaced.
Drug dosing
At day in vitro (DIV) 14, neurons were dosed with the following compounds and concentrations: 100 µM picrotoxin, 100 µM 4-aminopyridine, 100 µM carbachol, and 10 µM glutamate. All compounds were diluted from a stock solution in RCN media and added at 10x the final concentration to treatment groups. A no treatment control (NTC) dose of RCN media and 0.1% DMSO as a vehicle control were also included. A 5-minute recording was taken prior to dosing and served as the baseline measurement. After drug dosing, the plate was incubated for 1 hour in a 37°C incubator before another 5-minute “dosed” recording was taken. Following the dosed recording, the drug was washed out by performing a full media change (500 µL) on all wells. The plate was returned to the incubator, and the cells were maintained as normal.
Neural activity recording and analysis with the Maestro MEA platform
The Neural Spontaneous + Viability configuration in AxIS Navigator was used to measure both resistance (viability) and electrical activity from all electrodes in each well in a plate mounted in a Maestro Pro. To record, plates were pulled from the incubator, placed in the Maestro Pro, and allowed to equilibrate for 5 minutes. Five-minute recordings were taken at DIV7, at DIV14 (both pre- and post-drug dosing), and at DIV21. Spikes were detected with a threshold of 6 standard deviations above the noise. Neural data was analyzed using the Neural Metric Tool where electrodes were considered active if they had a minimum of 5 spikes per minute. Single bursts were detected as single electrodes where 5 spikes occurred with a maximum inter-spike interval (ISI) of 100 ms. Network bursts were detected using the “Adaptive” algorithm in the Neural Metric Tool, with the minimum number of spikes set to 50, the maximum ISI set to 100 ms, and the minimum electrode percentage set to 35%. The synchrony window was set to 20 ms. The recommended endpoint metrics were then exported from the Neural Metric Tool and visualized using the Axis Metric Plotting Tool.
Results
The Maestro Pro measures the development of neural activity over time
To monitor RCN cultures in vitro, we plated 40,000 cells per well of a 24-well CytoView MEA plate. We cultured the RCNs in BrainPhys™ Neuronal Medium with the NeuroCult™ SM1 Neuronal Supplement and maintained the cultures for up to 21 days. Figure 1 illustrates three important characteristics of the neural network: activity, synchrony, and oscillation. Activity, quantified by mean firing rate, refers to number of action potentials produced by the neurons in culture. High values mean that the neurons are firing action potentials more frequently, while low values indicate less frequent firing. Synchrony, quantified by area under the normalized cross correlation, describes the synaptic function of the cultures. With strong synaptic connections, an action potential in one neuron will affect the likelihood of an action potential in a neighboring neuron, increasing the chance of the neurons firing action potentials simultaneously.
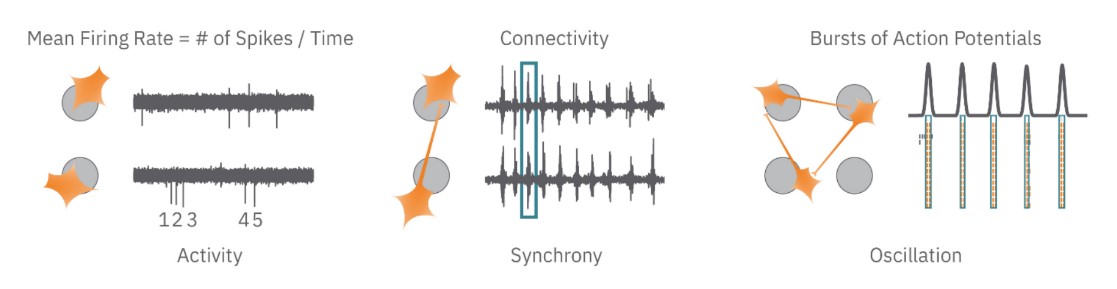
Finally, oscillation, quantified by the inter-spike interval (ISI) coefficient of variation, describes when neural cultures have alternating periods of high and low activity. This alternating activity is a hallmark of functional neural networks and reflects the presence of both excitatory and inhibitory neurons in the culture.
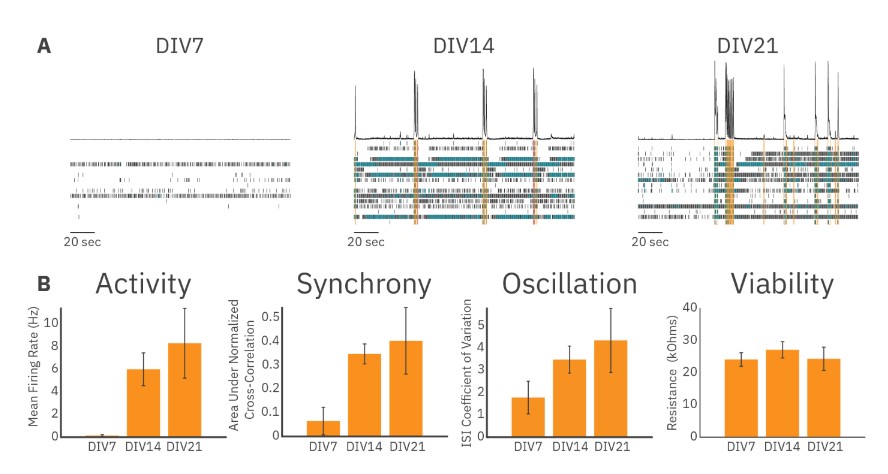
Figure 2 illustrates data collected from recordings of RCN cultures at DIV7, DIV14, and DIV21. Example raster plots of neural activity illustrate that uncoordinated, low-rate spiking took place in RCN cultures at DIV7, while more synchronous and highly active cultures were present at DIV14 and DIV21 (Figure 2A). Endpoints quantifying the overall activity, synchrony, and oscillations of RCN cultures were also calculated. Mean firing rate was low at DIV7 but increased significantly at DIV14 and further still by DIV21. The same increase over time was seen for the area under the normalized cross correlation and for the ISI coefficient of variation, measures of culture synchrony and oscillatory behavior, respectively. We also measured the resistance (MEA Viability) of the cell-electrode interface and found no significant change over 21 days (Figure 2B). These results demonstrate the ease of using the Maestro to study the electrophysiological development of in vitro neural cultures over time.
Neuroactive compounds cause distinct changes in RCN culture electrophysiology
In vitro RCN networks produced activity, synchrony, and oscillations, which represent key aspects of neuronal function in vivo. Next, we applied known neuroactive compounds to further characterize the biology and assay for detecting changes in functional network properties. Due to the complexity and difficulty of measuring neural signals in vivo, it is important to have reliable in vitro models of neural activity that are sensitive to neuroactive compounds.
Further, it is necessary to have quantitative measures of in vitro networks that can be used to assess the culture before and after dosing.
We optimized several parameters of our RCN cultures to improve the dynamic range of the assay for activity, synchrony, and oscillations. Importantly, the time of dosing (DIV14), media system (BrainPhys + SM1), and cell density (40,000 cells/well) produced an intermediate level of baseline neural activity for each measure, allowing for the detection of either increases or decreases in all three parameters. The day 14 time point also exhibited the highest well-to-well consistency, providing a good balance between sensitivity and reliability (Figure 2).
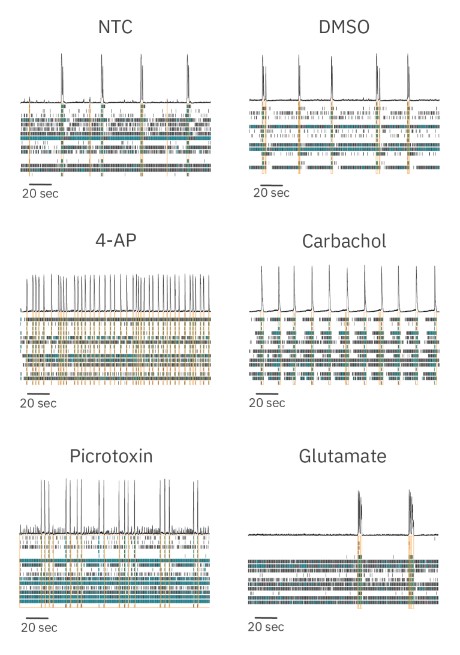
We dosed RCN cultures with several neuroactive compounds with different mechanisms of action and assessed the ability of our culture model to detect changes in activity, synchrony, and oscillations. We dosed RCN cultures with a no treatment control (NTC, media) and found no appreciable changes in any neural metric measured compared to baseline. Dosing with the vehicle control (DMSO) induced increases in activity but no changes to synchrony or oscillations. Four different compounds were used to modulate neural activity: picrotoxin, 4-aminopyridine (4-AP), carbachol, and glutamate. Raster plots collected from dosed neural cultures illustrate that each compound induced distinct and significant changes in neural activity (Figure 3).
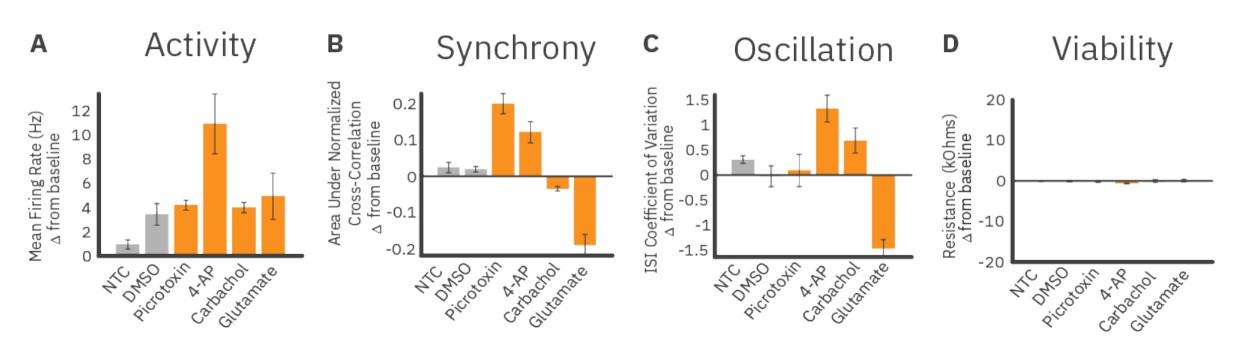
We quantified these measures of activity and plotted their changes post-dose relative to baseline values. Compared to the DMSO control group, dosing with 4-AP, a potassium channel blocker, increased activity, synchrony, and oscillation in RCN cultures. In contrast, dosing with glutamate, an excitatory neurotransmitter, led to large decreases in synchrony and oscillations. We also dosed RCN cultures with picrotoxin, a GABA antagonist and pro-convulsant, and carbachol, a cholinergic agonist. Picrotoxin dosing increased synchrony but did not affect oscillatory behavior compared to the DMSO control. By contrast, carbachol dosing led to a small decrease in synchrony but significantly increased oscillations. The dosing results for each endpoint of network function are shown in Figure 4. Resistance did not significantly decrease for any treatment condition, indicating that changes in neural activity were not due to cytotoxicity from the dosed compounds (Figure 4D).
Conclusion
In vitro models of the brain are valuable tools for screening candidate drugs and compounds and evaluating their interactions and toxicity on neural cells. However, to accurately characterize these models, experimental techniques must be able to accurately take functional measurements of in vitro neural network activity and have the sensitivity to assess changes in the in vitro network’s electrophysiology. In this study, we demonstrated that the Maestro Pro MEA system can record neural activity from multiple rat cortical neuron cultures in a high-throughput manner and is able to track the development of this activity over time. Further, the Maestro Pro was sufficiently sensitive to detect phenotypic changes in neural culture electrophysiology caused by compound dosing. These changes were then converted into digestible and descriptive metrics using Axion BioSystems’ suite of analysis tools, allowing for easy quantitative comparison of the pre- and post-dose phenotypes. In total, this study shows that the Maestro Pro can accurately characterize in vitro neural networks and distinctive electrophysiological changes in response to neuroactive compounds.
References
1. Bradley, J.A., Luithardt, H.H., Metea, M.R., and Strock, C.J. (2018). In Vitro Screening for Seizure Liability Using Microelectrode Array Technology. Toxicol. Sci. 163, 240–253. https://doi.org/10.1093/toxsci/kfy029.
2. McConnell, E.R., McClain, M.A., Ross, J., LeFew, W.R., and Shafer, T.J. (2012). Evaluation of multi-well microelectrode arrays for neurotoxicity screening using a chemical training set. Neurotoxicology 33, 1048–1057. https://doi.org/10.1016/j.neuro.2012.05.001.
3. Negri, J., Menon, V., and Young-Pearse, T.L. (2020). Assessment of Spontaneous Neuronal Activity In Vitro Using Multi-Well Multi-Electrode Arrays: Implications for Assay Development. eNeuro 7, ENEURO.0080-19.2019. https://doi.org/10.1523/ ENEURO.0080-19.2019.
Authors
Benjamin Streeter, Denise Sullivan, Daniel Millard
Axion BioSystems, Atlanta, GA, USA