Abstract
Different cell lines exhibit different patterns of growth and cell behavior that form their unique cellular profile. These time-dependent cellular profiles are sensitive not only to cell type, but also cell density, purity, and environmental interactions. In this study, we characterized the cellular profile of three common human cancer cell lines using the Maestro Z to continuously monitor cell proliferation. The Maestro Z real-time impedance assay readily distinguished profiles based on cell density and cell type, and the profiles reflected key features of cell adhesion, spread, growth, and morphology.
Introduction
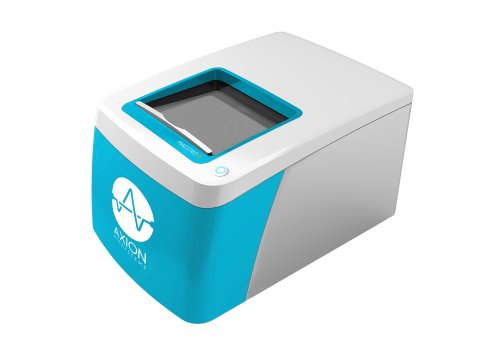
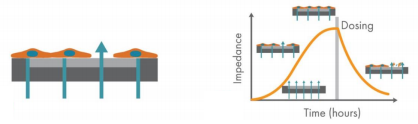
Cells grow, attach, and interact differently based on their biological function. Collectively, these properties result in a unique cellular profile over time. The Maestro Z impedance assay (Figure 1) accurately quantifies this cellular profile, providing a “fingerprint” to distinguish cells based on type, density, morphology, and attachment. The cellular profile can also be used to ensure cell quality and purity, quantify growth rates, and optimize assay timing. All of this information is available without complicated experimental setup or analysis. With the push of a button, the Maestro Z system will maintain environmental control and continuously, non-invasively monitor the cells as long as needed, while providing real-time growth curves and simple endpoint plots.
Here we used Axion BioSystems’ Maestro Z impedance assay to characterize the spread, adhesion, and growth of three human cell lines: HeLa, a ubiquitous cervical cancer cell line (Gey et al 1952; Lucey et al 2009), and A549 and Calu3, two lung endothelial cell lines (Ren et al 2016; Shen et al 1994). The differences between densities and between cell lines were examined.
Materials and Methods
Cells and reagents
HeLa (Cat. CCL-2), A549, (Cat. CCL-185), and Calu-3 (Cat. HTB-55) cells were obtained from ATCC (Manassas, VA). A549 media was prepared usingF12-k base media (Gibco, Cat. 21121077) , 10 % FBS (Gibco, Cat. 16000044), and 1% penicillin/streptomycin (Gibco, Cat. 15140122). HeLa and Calu3 media was prepared using MEM base media (Gibco, Cat 11095072), 10% FBS, and 1% penicillin/streptomycin.
CytoView-Z 96 plate
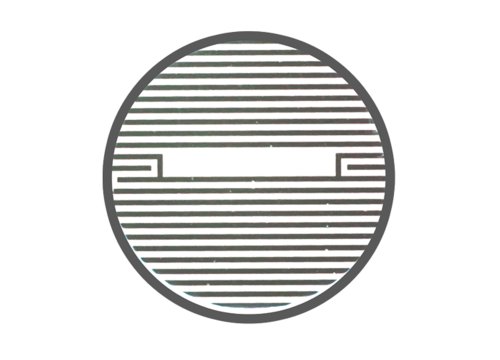
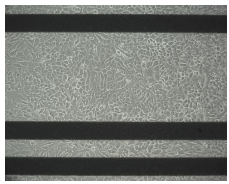
CytoView-Z 96-well plates (Axion BioSystems) were used for these experiments (Figure 2). The plate is composed of a polyethylene terephthalate (PET) surface with a gold recording electrode embedded in the culture surface of each well. Humidity reservoirs on the plate were filled with deionized water to maintain humidity.
Maestro Z Impedance-based assay platform
The Maestro Z platform (Axion Biosystems) uses impedance measurements (ohms, Ω) to quantify the presence of cells on the electrode. To measure impedance, small electrical signals are delivered to the electrodes (Figure 1). Cell attachment, spreading, and cell-cell connections block these electrical signals and are detected as an increase in impedance. Impedance is also sensitive to subtle changes in cell conformation, such as those caused by receptor-mediated signaling or cell morphology. Since impedance is non-invasive and label-free, impedance assays can be used to quantify dynamic cellular responses over minutes, hours, and days. In addition, the Maestro Z has built-in environmental control, finely controlling temperature and CO2 throughout the experiment.
CytoView-Z plate preparation
CytoView-Z plates were coated with 100 µL of fibronectin solution (1µg/mL) per well. Surface-coated impedance plates were incubated at 37°C and 5% CO2 for at least 1 hour. After incubation, excess surface coating was aspirated from each well. Then, 100 µL of complete medium was added per well and docked on the Maestro to record a media reference.
Cell culture
HeLa, A549, and Calu-3 cells were thawed and cultured according to the supplier recommendations, passaging as needed. Cells were detached from flasks and dissociated via trypsinization. Cell density and viability was determined using a hemocytometer. The cell suspension was transferred to a 15 mL conical tube and centrifuged at 1,000 RPM for 5 minutes. The supernatant was aspirated, being careful to not disturb the cell pellet. Cells were resuspended and diluted in media to a working concentration of cells per 100 µL. HeLa cells were analyzed at various densities (3125, 6250, 12500, 25000, 50,000/well, n = 8 replicate wells per conditions, Figure 3). A549 cells were plated at 350,000 cells/ml, and Calu3 cells were plated at 500,000 cells/ml. For compound testing experiments the cell density selected should achieve 100% confluency within 24 hours. It is recommended to run a cell density sweep before any compound testing to determine the optimal number of cells.
Results
Cell density affects growth rates
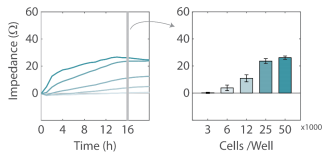
For a new cell line or plating procedure, a density sweep in which the impedance profiles are compared across several densities is often recommended to identify the optimal plating density for reaching confluency within 24 hours and to optimize assay timing. Here, five densities of HeLa cells were plated on the CytoView Z plate and their impedance was tracked by the Maestro Z for over 24 hours. As expected, the impedance profile differed across the cell densities (Figure 3). The highest density of HeLa cells (50,000 cells per well) showed the fastest growth rate during adhesion and growth, reaching confluence near 12 hours. By 16 hours, both the two highest densities had reached 100% confluency, as exhibited by the plateau in impedance, while the lower cell densities continued to grow and spread. The differences between cell densities are illustrated in Figure 3B, showing a significantly higher impedance for 250,000 and 50,000 cells per well compared to lower densities. The higher impedance most likely reflects a greater number of cells, but may also reflect slight differences in adhesion or cell shape at the varying levels of confluency.
Cell types easily distinguished by their impedance profile over time
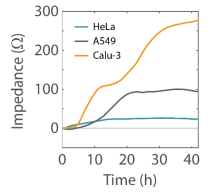
After identifying an optimal density for each line, three cancer cell lines were plated on a CytoView Z-plate. The Maestro Z was used to track the impedance profile of each cell line across 2 days. Each cell exhibited a unique impedance profile over time that reflected the characteristics of that cell type (Figure 4). HeLa cells attached and divided rapidly, reaching confluency in less than 10 hours. However, they exhibited the lowest maximum impedance value of the three cell lines, reflecting a less tightly packed sheet of elongated cells. In contrast, Calu-3 cells attach and spread quickly, but divide more slowly. Following attachment, their impedance continues to increase as they form tight junctions (Wan et al 2000) and continue to divide to fill in a very tightly packed sheet of flattened cells. Similar to the Calu-3 cells, A549 cells are lung epithelial cell line, yet they exhibit a distinct impedance profile reflecting a more loosely packed sheet lacking tight junctions (Ren et al 2016). A549 cells show an intermediate rise to confluency, with final impedance between Calu3 and HeLa cells.
Conclusion
The Maestro Z platform enables simple, label-free, non-invasive monitoring of cellular profiles. Here we showed that the Maestro Z impedance assay readily distinguishes the profiles of different cell densities, providing insight for protocol optimization. In addition, the Maestro Z impedance assay was sensitive to cell type, providing a unique cellular “fingerprint” that can distinguish cell types and reflect the morphology and behavior of the cells.
References
Gey GO, Coffman WD, and Kubicek MT, 1952 Cancer Res 12: 264-265.
Lucey BP, Nelson-Rees WA, and Hutchins GM, 2009 Arch Pathol Lab Med 133:1463-1467
Ren H, Birch NP, and Suresh V, 2016 PLoS One 11(10): e0165225.
Shen BQ et al, 1994 Lung Cell Mol Physiol 10: L493-L501.
Wan H et al, 2000 Eur Respir J 15(6): 1058-1068.