Key Findings
>> Proliferation can be quantified in adherent, nonadherent, and colony-forming cells in real time
>> Cell proliferation is dependent on serum concentration
>> Label-free imaging analysis correlates to Alamar Blue assay results
Abstract
The serum starvation assay is widely used to investigate cell stress responses in a variety of research fields, including immuno-oncology. In this study, the Omni live-cell imaging platform was used to quantify cell confluency over a prolonged period. It was shown that the end status of the cell population was consistent with the results from the Alamar Blue plate reader assay, which is often used to measure cell population state.
Introduction
Cell proliferation is a fundamental cellular process for most in vitro model systems, such as those used in immuno-oncology assays. The influence of drugs or other therapies on cell proliferation in vitro is a critical functional indicator. Proliferation assays must be reliable and sensitive to support their use throughout the product development pipeline.
Most proliferation assays use labels and only provide information at a single timepoint. For example, cell metabolic activity assays, such as the Alamar Blue assay, are widely used to determine cell viability. The cell metabolic activity correlates with the number of viable cells and can therefore provide information on cell proliferation. However, these assays provide limited kinetic information since measurements are not over time. Therefore, many technical replicates must be used and sampled at various timepoints in the assay to monitor cell proliferation performed over time. Additionally, labels add reagent cost and may be destructive to the sample.
By contrast, the Omni live-cell imaging platform provides real-time, whole-vessel brightfield images without the need for labels or additional reagents. The AI-based software then automatically detects cell confluency, allowing a real-time readout of cell proliferation.
Cell confluency may be quantified across various culture conditions, including adherent cells, nonadherent cells, and colony-forming cells. Similarly, the whole-vessel scan allows flexibility in the culture vessel (Fig. 1), from T25 flasks to 384- well plates.
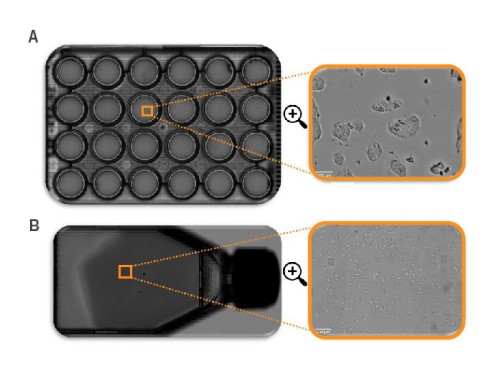
vessels. A) Full scan of a 24-well plate, B) full scan of a T25 flask. All
full scans can be zoomed in to single-cell level.
In this study, proliferation was monitored for three different cell types exhibiting diverse proliferation profiles. Also, proliferation was quantified in a serum starvation experiment using the real-time, whole-vessel brightfield scan from the Omni, and the results were compared to a traditional label-based plate reader assay. The results demonstrate that the Omni proliferation assay is comparable to the widely used Alamar Blue endpoint assay.
Materials and Methods
Cells and reagents
Jurkat T cells (ATCC, Cat. Tib152), Calu3 cells (ATCC, HTB-55), and A549 cells (ATCC, CRM-CCL-185) were cultured in RPMI, MEM base, and F12 medium, respectively. All media were supplemented with Fetal Bovine Serum (FBS, Gibco, Cat. 16000044), to a final concentration of 10%, and Penicillin/ Streptomycin (P/S, Gibco, Cat. 15140122), to a final concentration of 1%.
Cell proliferation assay
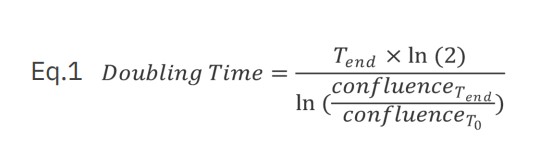
Jurkat T cells, Calu3, and A549 cells were seeded in a 48-well plate in corresponding media using various seeding densities (Jurkat and Calu3 cells range between 5,000 – 40,000 cells/well; A549 cells range between 1,000 – 10,000 cells/well) using four replicates per group. The plate was monitored using the Omni with a time interval of two hours. A growth curve was automatically generated with the Confluency Analysis Module. In addition to the proliferation curve, the doubling time was calculated for each cell type and each seeding density using equation 1 where T is time (hours).
Serum starvation assay
The influence of serum starvation on the proliferation of cells was studied using A549 cells. A549 cells were seeded in a 48-well plate (5,000 cells/well) using a variety of FBS concentrations (1) 0%, (2) 1%, (3) 5%, (4) 10% in the medium with twelve replicates per group. The doubling time of A549 cells can take up to 40 hours1. Therefore, the proliferation curve was monitored in real time for 120 hours, making a scan every four hours to ensure at least three population doublings are incorporated. To compensate for differences in seeding densities, confluency percentages were normalized to relative values at T=0 hours.
Alamar Blue assay
The Alamar Blue assay measures the reduction of blue resazurin dye to pink resorufin by metabolically active, viable cells. After imaging for 120 hours, the cells were washed with PBS twice. Culture media with 10% resazurin dye was then added to each well. The cells were incubated with this solution for one hour at 37°C and 5% CO2. Afterwards, 100 µl medium of each well was transferred to a clear 96- well plate and fluorescence was read using a plate reader (corresponding wavelengths: Excitation - 535 nm, Emission - 595 nm).
Results
The optimal seeding density varies between different cell types
The influence of the seeding density on the growth rate of different cell types can be measured using the confluency levels over time. In Figure 2, three different cell types with different growth behaviors are shown. The Jurkat T cells are nonadherent suspension cells that tend to cluster immediately upon seeding, resulting in a small decrease in confluency levels for the first 10 hours. Therefore, the doubling time is also measured using the time corresponding with the lowest confluency as T0. After clustering, an increase in confluence levels is seen when cells were seeded with 20,000 or 40,000 cells/well, which indicates active proliferation. For a seeding density of 40,000 cells/well, the growth curve is the steepest, meaning that cells proliferate most actively.
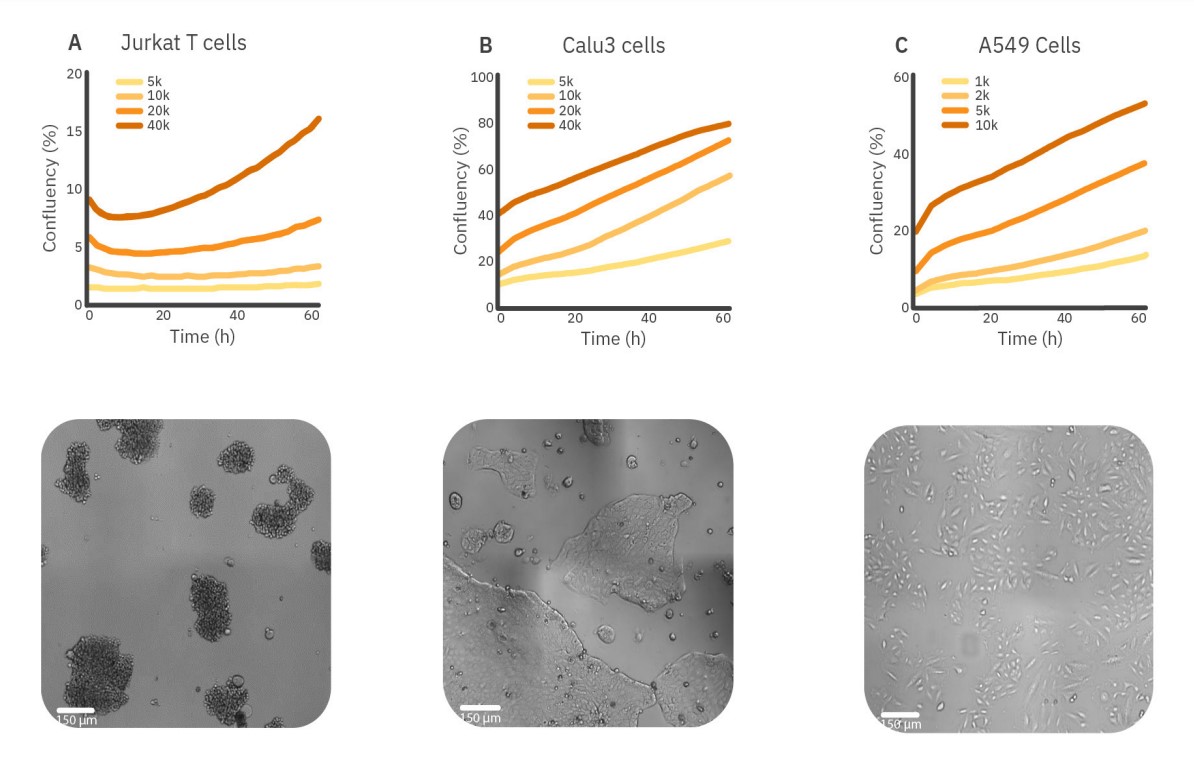
For a seeding density of 40,000 cells/well, the doubling time was three times faster compared to the lowest seeding density, 49 hours to 154 hours, respectively. Like Jurkat T cells, Calu3 cells adhere to the surface and form dense clusters during proliferation. The growth curves indicate active proliferation for all seeding densities. However, the proliferation rate is higher for 10,000 and 20,000 cells/well. This is in line with the doubling time that is the shortest for 10,000 cells/well, namely 31 hours.
In contrast to the other cell types, A549 cells do not grow in clusters. The A549 cells show less active proliferation for a seeding density of 10,000 cells/ well compared to 2,000 and 5,000 cells/well. The doubling time also increased to 43 hours compared to approximately 30 hours for 2,000 and 5,000 cells/well.
These results may indicate that suspension cells, as well as adherent cells that grow in clusters, benefit from higher seeding densities, whereas adherent, non-clustering cells benefit from lower seeding densities.
Reduced serum in media inhibits cell proliferation
Serum, such as FBS, is added to the cell growth medium to induce cell attachment and proliferation. Generally, a concentration between 2-10% FBS is used. Lower FBS concentrations (serum starvation) can result in the arrest of cell growth and apoptosis. The effect of serum starvation on A549 cells is shown in Figure 3. The addition of 10% FBS immediately stimulates the proliferation of A549 cells, while 5% FBS shows a more gradual effect.
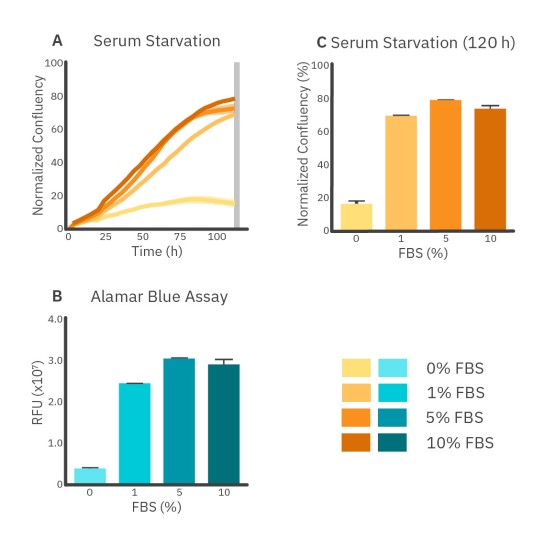
The 10% FBS groups show a plateau in the growth curve starting from approximately 80 hours, a decrease in proliferation that could be due to contact inhibition caused by the high relative confluency levels2 (Fig. 3A). Furthermore, the difference between 5% FBS and 10% FBS at T=120 hours is not significant while the viability of 0% FBS and 1% FBS are significantly lower than 5% FBS and 10% FBS after 120 hours. This was seen in both the Alamar Blue assay and the serum starvation assay at T=120 hours (Fig. 3B and C).
Overall, the Alamar Blue assay indicates minimal differences between each group that contained FBS. However, differences in growth rates are clearer from Omni imaging results over time which show a similar cell growth rate for 5% FBS and 10% FBS, but slower cell growth for 1% FBS during the first 80 hours.
Conclusion
In conclusion, the Omni platform allows for efficient monitoring of cell proliferation over time. The quantitative data is automatically measured in parallel during the experiment using the Confluency Analysis Module. In this study, we showed that the confluency data corresponds with the widely known Alamar Blue endpoint assay. The label-free, whole-vessel confluency assay on the Omni is a simple and easy-to-perform method applicable to a wide range of cell types.
References
[1.] Synthego. Everything You Need to Know About A549 Cells. https://www.synthego.com/a549-cells#:~:text=A549%20cells%20doubling%20time%20is,in%20liquid%20nitrogen%20vapor%20 phase.
[2.] Pavel, M., Renna, M., Park, S. J., Menzies, F. M., Ricketts, T., Füllgrabe, J., ... & Rubinsztein, D. C. (2018). Contact inhibition controls cell survival and proliferation via YAP/TAZ-autophagy axis. Nature communications, 9(1), 2961.
Authors
Linda Boekestijn & Benjamin Streeter
Axion BioSystems, Atlanta, GA