Key Findings
>> Live-cell imaging allows for kinetic measurement and analysis of mammalian colony formation.
>> Continuous monitoring ensures optimal assay timing.
>> Doxorubicin has a dose-dependent effect on the formation of colonies by CHO-K1 cells.
Abstract
Doxorubicin (Dox) is one of the chemotherapy substituents used to inhibit the growth of tumors. The effectiveness of cancer treatment is often evaluated using in vitro cell survival assays like the clonogenic assay. In this study, we examined the effect of a range of Dox concentrations on the growth of single CHO-K1 cells into colonies. Hereby, an automated label-free method was used to analyze the size, number, and circularity of colonies. Dox was shown to have a significant dose-dependent effect on both the number and growth of CHO-K1 colonies.
Introduction
The clonogenic assay, also known as colony formation assay is an in vitro cell survival assay1. It assesses the ability of single cells to survive and reproduce to form colonies. This assay was first described in the 1950s, where it was used to study the effects of radiation on cancer cell survival and growth and has subsequently played an essential role in cancer research, allowing for relatively easy drug screening and radiation dosing2. In order to measure clonogenicity in traditional clonogenic assays, cells need to be seeded at very low densities and left for a period of 1-3 weeks for colonies to form. Colonies are then fixed, stained with crystal violet to make them visible, and counted. Today, clonogenic assays are used to answer a variety of experimental questions, especially in cancer biology.
Although this manual assay is the current golden standard, it has a few disadvantages. The quantification and scoring of the colonies are laborious and only results in one parameter, specifically, colony count. This method does not give any insight into the size of the colonies and their growth over time. It is also prone to intra-operator variation, as a colony is defined to consist of at least 50 cells, making the output fully dependent on the ability of the operator to visualize and count colonies3. The assay is mostly performed in a 6-well plate to ensure that cells have sufficient time to form proper colonies while not overlapping, which would create erroneous results. This hinders the ability to scale up to larger plate formats, limiting the testing of multiple drug concentrations or radiation doses with sufficient biological repeats4. In addition, crystal violet is extremely toxic, and some colonies may be lost during washing and staining steps.
These challenges make it difficult to ensure a proper quantifiable and repeatable assay. Therefore, we propose a label-free and fully automated live-cell imaging method to quantify mammalian colony formation and growth over time.
In this study, a clonogenic assay was performed in a 24- well plate format, after pre-treating CHO-K1 cells with a range of concentrations of the common chemotherapy drug, doxorubicin (Dox). We quantified colony growth and number over time using the Omni, providing a complete overview of all the samples without disturbing the cells. Live-cell imaging, enabled easy and accurate determination of the tipping point when colonies started to merge, allowing to set well-defined end points for this specific assay.
Materials and Methods
Cell culture and drug treatment
CHO-K1 cells were seeded in a 6-well plate at a concentration of 50,000 cells per well in F12 Nutrient mixture medium (Invitrogen) supplemented with 10% Fetal Bovine Serum (FBS; Gibco) and 1% penicillin-streptomycin (PS; Gibco). Hourly scans were performed on the Omni in an incubator. After the cells reached 70% confluency, the cells were rinsed twice with phosphate-buffered saline (PBS; Gibco) and treated with (except for the control) 0.2, 0.5, 1.0, 2.0, or 5.0 µM Dox (D1515- 10MG, Sigma Aldrich), respectively. After 1 hour, the cells were rinsed twice with PBS, trypsinized, and counted using the Exact. Treated cells were seeded in a 24-well plate, 100 cells per well (N=4), and incubated at 37°C and 5% CO2.
Colony detection using the Omni
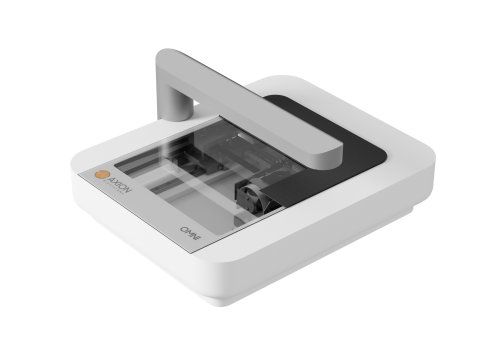
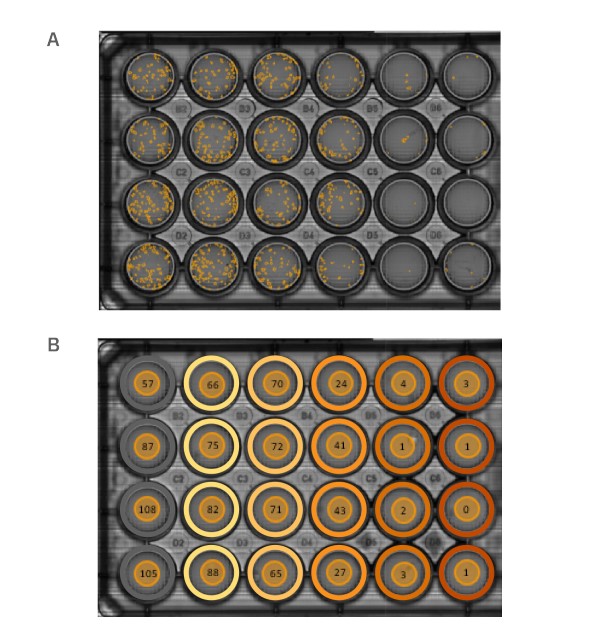
Following treatment with Dox, newly formed CHO-K1 colonies were analyzed using the Omni (Fig.1). A full-plate scan was generated every 12 hours. The Clonogenic Assay module automatically determined the number, size, and circularity of all the colonies over time.
Colony growth analysis
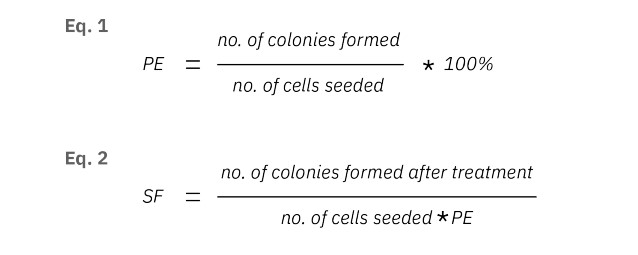
The number of colonies seeded in each well and the number of colonies at T = 120 were used to determine the plating efficiency (Eq.1) and the surviving fraction (Eq.2). To calculate the IC50, a dose-response curve was made by fitting a nonlinear curve of the normalized survival fraction on a logarithmic scale. The concentration that results in a 50% decrease of the survival fraction is described as the IC50 value.
The statistical differences in colony count were analyzed using two-way ANOVA followed by a Tukey’s multiple comparison test in Graphpad Prism (V8.02). Values were considered significant at p<0.05. All data is reported as mean ± standard error of mean.
Results
Real-time tracking identifies assay tipping point for optimal timing
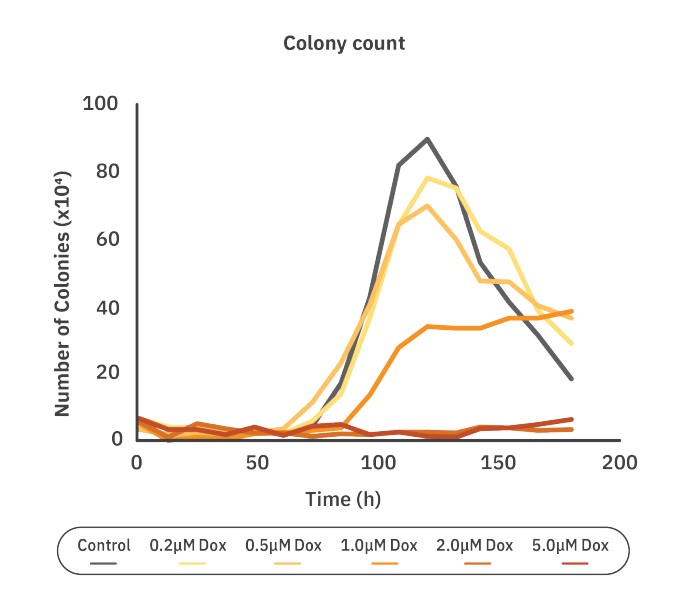
Determining the tipping point in a clonogenic assay enables the researcher to determine the effect of the treatment on colony growth before clustering occurs. The tipping point was measured using the colony count graph. After 120 hours the number of colonies starts to decrease, while the colony size starts to increase for the control group, indicating overlapping and merging of colonies. Therefore, 120 hours was selected to be the ideal time point to calculate the plating efficiency, surviving fraction, and IC50. In the traditional end point clonogenic assays, the end point is predefined. Clustering of colonies can occur before pre-defined end points, decreasing the accuracy of the number of colonies. The use of live-cell imaging makes it easier to make decisions during a running experiment.
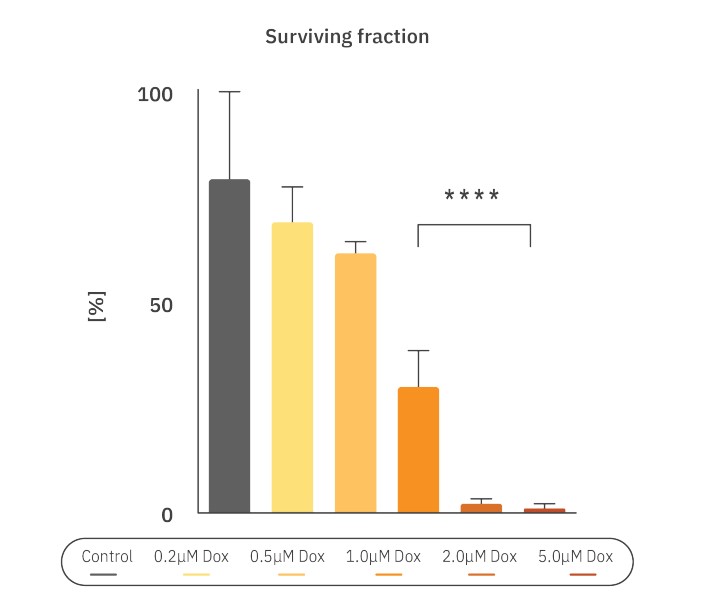
Doxorubicin decreases the surviving fraction of CHO-K1 colony formation in a dose-dependent manner
The cell survival curve was made to quantify the chemotoxic effect on CHO-K1 cells. The surviving fraction and plating efficiency (PE) were calculated as described in the Methods. Here, PE was calculated to be 89.25%. The surviving fraction (SF) is the number of colonies that arises after treatment, normalized to the PE of the untreated control. The SF for the control group was 79.7% ± 20.9% , while the SF for the cells treated with 0.2 and 0.5 µM Dox was 69.4% ± 8.4% and 62.0% ± 2.8%, respectively. For cells treated with the 1.0 (30.1% ± 8.6%,), 2.0 (2.2% ± 1.2%,) and 5.0 (1.1% ± 0.9%,) µM of Dox, the SF was significantly lower compared to the control group (p<0.0001) (Fig. 3). Higher concentrations of Dox contributed to a lower surviving fraction of the colonies, especially for concentrations above 1.0 µM.
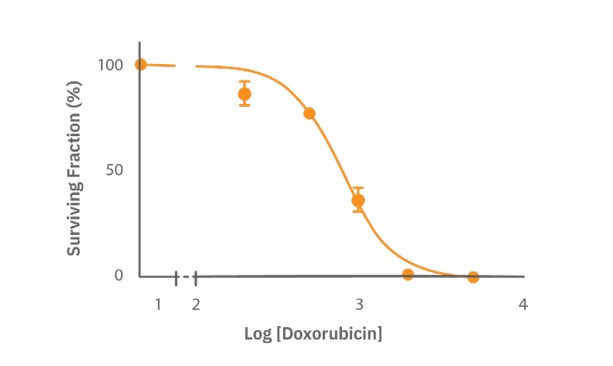
To calculate the IC50, a dose-response curve was made by fitting a nonlinear curve of the normalized survival fraction (Fig. 4, R2=0.92 ). The IC50 was determined to be 0.78 µM Dox. These results support the inhibitory effect of Dox on colony formation, but also the effectiveness of the Omni to automatically analyze the colony size and number and define the tipping point.
Conclusions
The Omni allows for automated, low-laborious, and label-free imaging and analysis of mammalian colony formation over time directly inside the incubator. This method can be used to accurately define the number of colonies, surviving fraction, and IC50 values for different cancer cell lines and drugs through identification of optimal assay timing. In this study, we demonstrated that Dox showed chemotoxic effects that inhibit colony formation of CHO-K1 cells in a dose-dependent manner.
References
- Franken, N. A. P., Rodermond, H. M., Stap, J., Haveman, J. & van Bree, C. Clonogenic assay of cells in vitro. Nat. Protoc. 1, 2315–2319 (2006).
- Puck, T. T. & Marcus, P. I. A Rapid Method for Viable Cell Titration and Clone Production with Hela Cells in Tissue Culture: The Use Of X-Irradiated Cells to Supply Conditioning Factors. Proc. Natl. Acad. Sci. 41, 432–437 (1955).
- Rafehi, H., Orlowski, C., Georgiadis, G. T., Ververis, K., El-Osta, A., & Karagiannis, T. C. (2011). Clonogenic assay: adherent cells. JoVE (Journal of Visualized Experiments), (49), e2573.
- Nikzad, S., & Hashemi, B. (2014). MTT assay instead of the clonogenic assay in measuring the response of cells to ionizing radiation. J Radiobiol, 1(1), 3-8.
Authors
Lieke Stemkens, Senior Applications Scientist; Linda Boekestijn, Application Scientist
Axion BioSystems, Application Science Department; Technologies; Eindhoven, Netherlands