Key Findings
>> Paclitaxel (PX) affects viability, morphology, and adhesion of C6 cells
>> The effects of PX are concentration-dependent
>> Long-term cytotoxic effects can be tracked with live-cell imaging
Abstract
Cell viability and cytotoxicity assays are often used to understand the mechanism and potency of novel drugs or cell therapies. Assessing the degree and dynamics of the target cell response in vitro is vital, but endpoint assays only provide a snapshot and can miss key indicators of cellular response. Here we demonstrate a real-time, label-free method using live-cell imaging on the Omni platform to assess the long-term cytotoxic properties of a known compound on C6 rat glioma cells.
Introduction
Cell viability is of interest to many researchers in the fields of drug development, cancer research, and regenerative medicine. Today, more and more research is focused on the long-term effects of therapeutic compounds on cell viability. Common methods to determine cell viability are cell counting, live/dead viability staining, and metabolic activity assays.
Counting cells using dye exclusion methods (such as the trypan blue exclusion technique) is simple and quick but does require the cells to be in a single-cell suspension before counting them with a hemocytometer or automated cell counter1. This invasive technique makes cell counting unsuitable for long-term viability monitoring. One option to enable long-term viability monitoring using cell counting is to repeat the cell counts with different samples at different time points, which requires high numbers of cells, disposables, and reagents. Moreover, this method is very time-consuming and labor-intensive since the samples need to be counted one at a time.
A live/dead viability staining usually consists of a dye that specifically stains live cells combined with another dye that stains dead cells1. The ratio of live and dead cells can easily be determined by counting the cells manually or by using image analysis software. This method provides very accurate live/dead counts but can also be very time-consuming when analyzing large numbers of samples. Furthermore, some of the dyes that are used can be toxic upon long incubation times.
An issue that can occur in the case of long-term viability monitoring is fading of the dye over time due to cell division during the experiment.
The well-known MTT2 and resazurin (Alamar Blue3) assays use metabolic activity as a measure of cell viability4. A compound of a certain color is enzymatically converted into a (fluorescent) compound of a different color by metabolically active cells. The amount of absorbance/ fluorescence of the converted compound can thus be used as a measure of cell viability. The advantage of metabolic activity assays over cell counting and live/dead staining is that multiple samples can easily be analyzed at once with the use of a plate reader. However, they are unfit for long-term viability monitoring since most of the reagents are toxic4. The only option to measure viability at multiple time points is to use numerous samples, requiring high numbers of cells, disposables, and reagents. Furthermore, a plateau in the absorbance/ fluorescence could be reached if the compound is completely converted.
A noninvasive alternative for these methods is to use confluency as a measure of viability. By taking images of cultured cells at several time points, the viability can be followed over time without the need for toxic reagents or sacrificing samples, thus decreasing the number of samples needed. When using the Omni, an automated live-cell imager, multiple samples can be analyzed at the same time inside a regular CO2 incubator. This allows for automated confluency analysis (using the integrated software) at predefined intervals and optimal culture conditions.
The aim of this study was to perform a long-term viability study using confluency measurements obtained with the Omni.
Materials and Methods
A 96-well plate was seeded with C6 cells (rat glial tumor cells) at a density of 21,875 cells/cm2 in Advanced DMEM (Invitrogen) supplemented with 10% FBS (Gibco) and 1% penicillin-streptomycin (Gibco). After 24 h of culture (37° C and 5% CO2), the microtubule stabilizer paclitaxel (PX; Invitrogen) was added to the cells at concentrations ranging from 1 nM to 1000 nM. The well plate was placed on the Omni (at 37° C and 5% CO2) to make a high-resolution scan every hour for 70 h after the addition of PX (n = 8 per group). The integrated image analysis software was used to determine the confluency of each individual well at each time point. The confluency data of each time point was downloaded from the Axion Portal and normalized for the confluency of the same well at 0 h, to account for differences in confluency at t = 0 h. The half-maximal effective concentration (EC50) was calculated using GraphPad Prism v8.0.2.
Results
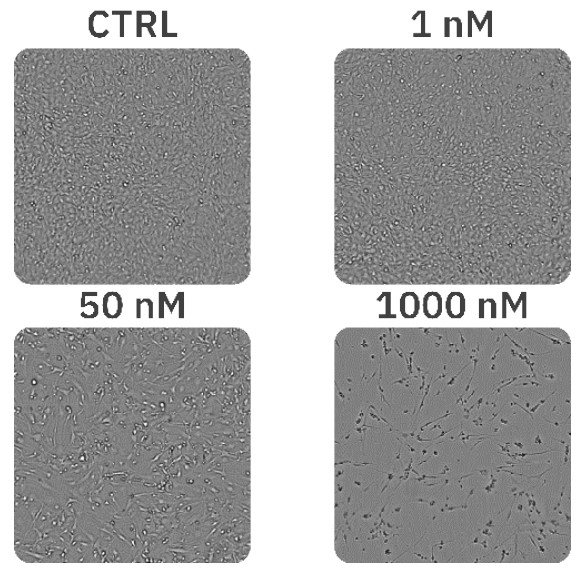
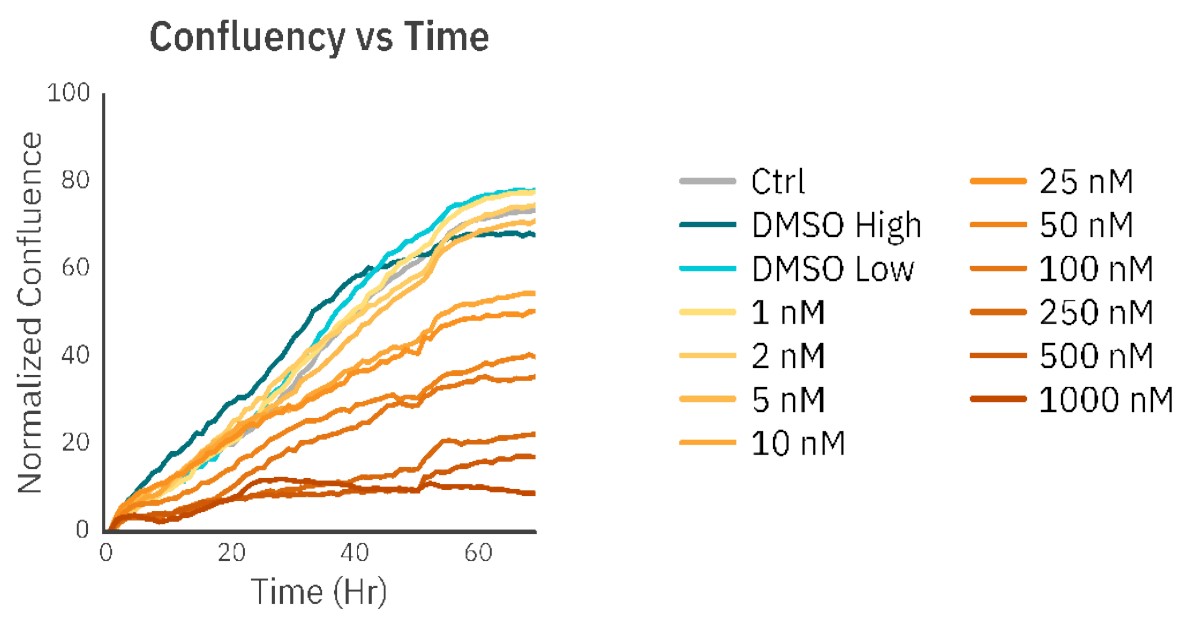
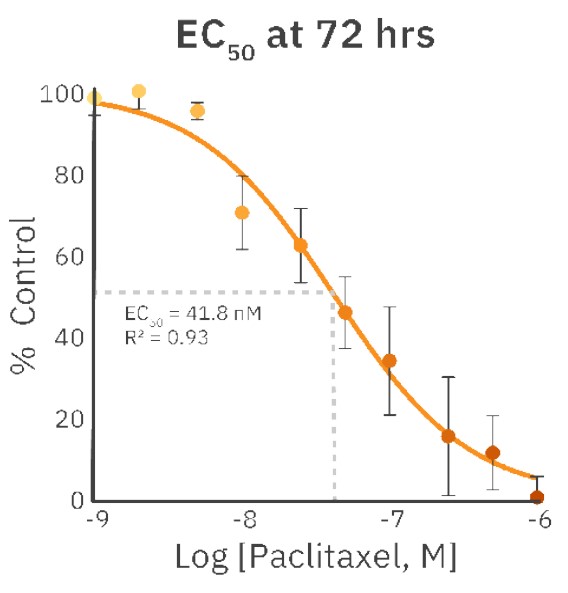
The concentrations of 1 nM, 2 nM, and 5 nM PX did not affect cell morphology or proliferation (Fig. 1, Fig. 2B) and were comparable to an untreated control (Fig. 1, Fig. 2A). The treatments of 10 nM and 25 nM PX exhibited less severe cell morphology alteration and death as compared to 50 nM and 100 nM PX treatments. This was indicated by the formation of gaps in cell monolayer, rounding and detachment of cells, as well as a decrease in normalized confluency (Fig. 1, Fig. 2C). Twenty hours after the addition of 250 nM, 500 nM, and 1000 nM PX, the cells started to exhibit changes in morphology, followed by cell body shrinkage and formation of elongated protrusions (Fig. 2D). These treatments showed the most prominent reduction in normalized cell confluency (Fig. 1). The outlined results are in alignment with the values of the EC50 calculation (EC50 = 41.8 nM; R2 = 0.93) (Fig. 3).
Discussion
Cell viability is generally determined via cell counting, live/dead staining, or metabolic activity assays. However, the common drawback of these methods is that they use invasive methods and cannot be used for long-term viability monitoring. A noninvasive alternative for these methods is to use confluency as a measure of viability. Therefore, we aimed to perform a long-term viability study using confluency measurements obtained with the Omni.
In this study, we showed that cell viability of C6 cells treated with PX could easily be determined from images obtained every hour with the Omni. At all time points, the normalized confluency of the untreated samples was significantly higher than that of the PX-treated samples. Since PX is a microtubule stabilizer, it causes defects in mitotic spindle formation, thus inhibiting chromosome segregation and, subsequently, cell division5.
This mechanism of action explains the lower (normalized) confluency of all groups treated with PX compared to the untreated group at all time points. The use of real-time live-cell imaging to monitor cell viability provides not only quantitative data on confluency but also qualitative information about cell morphology.
Morphological changes provide extra information about the effect of a compound on the cells; this information is lacking when analyzing cell viability by using metabolic activity assays or cell counting.
Conclusion
To summarize, in this study, we showed that long-term PX treatment affected not only cell viability but also cell morphology. Upon increase in the PX concentrations, the morphological alterations increased and the confluency level decreased. Furthermore, the noninvasive confluency measurements allowed for long-term monitoring of cell viability in real time. Using the Omni also provided the benefit of culturing cells in the optimal culture conditions while monitoring changes in cell confluency and morphology.
References
[1.] M. J. Stoddart, “Mammalian Cell Viability,” vol. 740, pp. 1–6, 2011.
[2.] T. Mosmann, “Rapid colorimetric assay for cellular growth and survival: Application to proliferation and cytotoxicity assays,” J. Immunol. Methods, vol. 65, no. 1–2, pp. 55–63, 1983.
[3.] S. Ansar Ahmed, R. M. Gogal, and J. E. Walsh, “A new rapid and simple non-radioactive assay to monitor and determine the proliferation of lymphocytes: an alternative to [3H]thymidine incorporation assay,” J. Immunol. Methods, vol. 170, no. 2, pp. 211–224, 1994.
[4.] T. L. Riss et al., “Cell Viability Assays,” in Assay Guidance Manual [Internet], vol. 114, no. 8, K. Sittampalam, G. S.; Coussens, N.P.; Brimacombe, Ed. Bethesda (MD): Eli Lilly & Company and the National Center for Advancing Translational Sciences, 2013, pp. 785– 796.
[5.] B. A. Weaver, “How Taxol/paclitaxel kills cancer cells,” Mol. Biol. Cell, vol. 25, no. 18, pp. 2677–2681, 2014.
[6.] O. Loubani and D. W. Hoskin, “Paclitaxel Inhibits Natural Killer Cell Binding to Target Cells by Down-Regulating Adhesion Molecule Expression,” vol. 742, pp. 735–741, 2005.
[7.] Y. Ling, Y. Zhong, and R. Perez-Soler, “Disruption of cell adhesion and caspase-mediated proteolysis of beta- and gamma-catenins and APC protein in paclitaxel-induced apoptosis.,” Mol. Pharmacol., vol. 59, no. 3, pp. 593–603, 2001.
Authors
Lieke Stemkens and Inge Thijssen - van Loosdregt
Axion BioSystems, Atlanta, GA