In collaboration with Promega.
Key Findings
>> The Maestro Z™ accurately and continuously measures immune cell-mediated killing over time.
>> CAR T potency is dependent on the antigen expression on the target cancer cell line.
>> Differences in target cell antigen expression influence IFN-γ and TNF-α release.
Abstract
Chimeric antigen receptor (CAR) modified T cells represent a promising avenue in immunotherapy. There is a crucial need to understand how the density of the target antigen influences the activity of CAR T cells. However, a major limitation of current in vitro potency workflows is restriction to one functional readout at a single time point. In this study, we cocultured human epidermal growth factor receptor 2 (HER2) CAR T cells with multiple target cancer lines, each exhibiting varying levels of HER-2 antigen expression. We then used a multiplexed approach to assess both target cell death using the Maestro Z and cytokine release with homogeneous Promega Lumit® immunoassays.
Introduction
The development of immunotherapies relies on the use of in vitro potency assays. They can be used to characterize the proliferation, cytokine release, and cytotoxic activity of immune effector cells, which is crucial for understanding their complex interactions with target cancer cells. One immunotherapeutic approach is CAR T-cell therapy, which accounts for over 50% of cell immunotherapies in development today.1
CAR T-cell therapies have shown unprecedented therapeutic efficacy. A key contributor impacting CAR T cell potency is target cell antigen density, as studies have shown when antigen expression falls below a certain threshold, CAR T cells struggle to induce meaningful antitumor activity.2 Therefore, understanding the impact of varying levels of antigen expression on tumor cells is essential for predicting the success of CAR T cell-mediated killing and cytokine release.
Traditionally, potency assays are performed at a single endpoint with considerable resources required to capture multiple timepoints. This limitation of measuring assays at predetermined timepoints often leads scientists to miss critical events such as the point of peak killing.3 To combat this limitation, assay multiplexing is increasingly being recognized as a vital tool in the scientific community. It enables researchers to gain a more comprehensive understanding of biological systems by measuring multiple parameters simultaneously.
In this study, we performed a noninvasive immunotherapy potency assay using the Maestro Z, a platform that can continuously monitor cell mediated killing. The influence of target cell antigen density on HER2 CAR T cell killing and cytokine release of tumor necrosis factor-alpha (TNF-α) and interferon gamma (IFN-γ) were compared using the following target cell types: SKOV3 (high HER2 expression), A549 (low HER2 expression), or MDAMB-231 (no HER2 expression).
Materials and Methods
Cells and reagents
SKOV3 (Cat. HTB-77), A549 (Cat. CCL-185) were obtained from ATCC (Manassas, VA). MDA-MB-231 (Cat. P20317) were obtained from Innoprot (Bizkaia, Spain). SKOV3 media was composed of McCoy’s 5A Medium Modified (ATCC, Cat. 30-2007), 10% FBS (Gibco, Cat. 16000044), and 1% penicillin/ streptomycin (Gibco, Cat. 15140122). A549 media was composed of F12-K base media (Gibco, Cat. 1127022), 10% FBS (Gibco, Cat 16000044), and 1% penicillin/streptomycin (Gibco, Cat. 15140122). MDA-MB-231 media was composed of RPMI 1640 (Gibco, Cat. 11875093), 10% FBS (Gibco, Cat. 16000044), 1% penicillin/streptomycin (Gibco, Cat. 15140122), 1x GlutaMAX (Gibco, Cat. 35050061), and 10ug/mL Puromycin (Gibco, Cat. A1113803).
CAR T cells targeting HER2 (HER2scFv-4-1BBCD3z, Cat. PM-CAR1070-1M) and CAR T cell media (Cat. PM-CAR2001) were obtained from ProMab Biotechnologies (Richmond, CA).
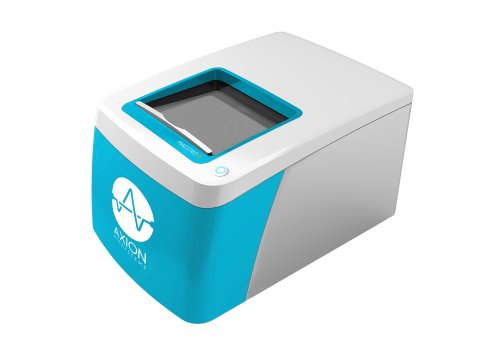
Maestro Z assay platform
The Maestro Z platform (Axion BioSystems) uses impedance measurements (ohms, Ω) to quantify the presence of cells on electrodes embedded in the bottom of the wells of CytoView-Z plates™ (Axion BioSystems). Cellular impedance is a well-established technique for measuring cell attachment, spreading, proliferation, coupling, membrane integrity (cell death), and subtle changes in cell conformation. Detection is noninvasive and label-free, so it can quantify dynamic cellular responses over minutes, hours, and days. The Maestro Z’s built-in environmental controls finely control temperature and CO2, ensuring a consistent, optimal experimental environment.
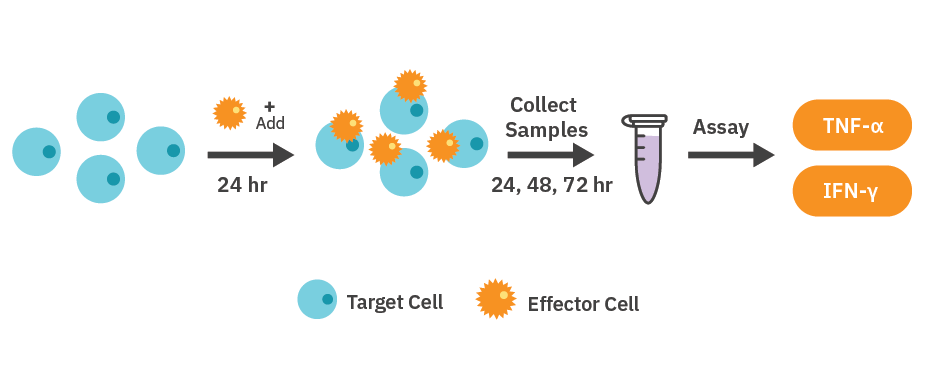
Plate preparation
CytoView-Z 96-well plates (Axion BioSystems) were used for the experiment. The surface of the plate was coated with 100 µL of fibronectin solution (1ug/ mL) per well and incubated at 37°C and 5% CO2 for at least one hour. After incubation, excess surface coating was aspirated from each well. Then 100 µL of complete medium, depending on cell type, was added per well then docked on the Maestro Z platform to record a media only baseline.
HER2 CAR T cell-mediated cytotoxicity assay
SKOV3, A549, and MDA-MB-231 cells were thawed and cultured following the supplier’s guidelines. Once confluent, the cells were detached from the culture flasks using trypsinization. Each resulting cell suspension was then placed into a 15 mL conical tube and centrifuged at 200 x g for five minutes. Supernatant was removed carefully to avoid disrupting the cell pellet.
Cell density and viability were determined using a hemocytometer and trypan blue solution. SKOV3 cells were resuspended to a working concentration of 2,500 cells per 100 µL, while A549 and MDAMB-231 cells were resuspended to a working concentration of 5,000 cells per 100 µL, for a total well volume of 200 µL. Media was added to the ‘Media Only Control’ wells and sterile DI water (8 mL) was added to the on-plate reservoirs to maintain humidity. The plate was left to rest for 1 hour at room temperature in the biosafety cabinet, then docked in the Maestro Z and kept at 37°C and 5% CO2.
HER2 CAR T cells were thawed and cultured according to the manufacturer’s recommendations. Approximately 24 hours after plating SKOV3, A549, and MDA-MB-231 cells, CAR T cells were resuspended in 10x the desired final concentration, and then 22.2 µL of the cell suspension was added at a 1:5 or 1:1 E:T ratio. The same volume of media was added to the ‘No Treatment’ and ‘Media Only’ control wells. TritonX-100 (1%) was added to the ‘Full Lysis’ control wells.
Calculation of cytolysis
%Cytolysis was used to quantify cell death and was calculated using the following equation:
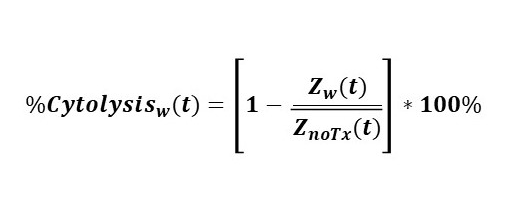
Where:
| is a time series and the mean of the no treatment control wells. | |
| is a time series and the mean of the full lysis control wells. |
Cytokine measurements
At relevant timepoints, medium containing both the target cells and CAR T cells was collected from one plate and placed into 1.5 mL microcentrifuge tubes, followed by centrifugation at 300 x g for 1 minute. The resulting supernatant was carefully collected, taking care not to disrupt the cell pellet, then stored at -20°C until analysis. Cytokine release was measured using the Lumit® IFN-γ (Human) Immunoassay (Promega, Cat. W6040) and Lumit® TNF-α (Human) Immunoassay (Promega, Cat. W6050), following the manufacturer’s sample transfer method.
Results
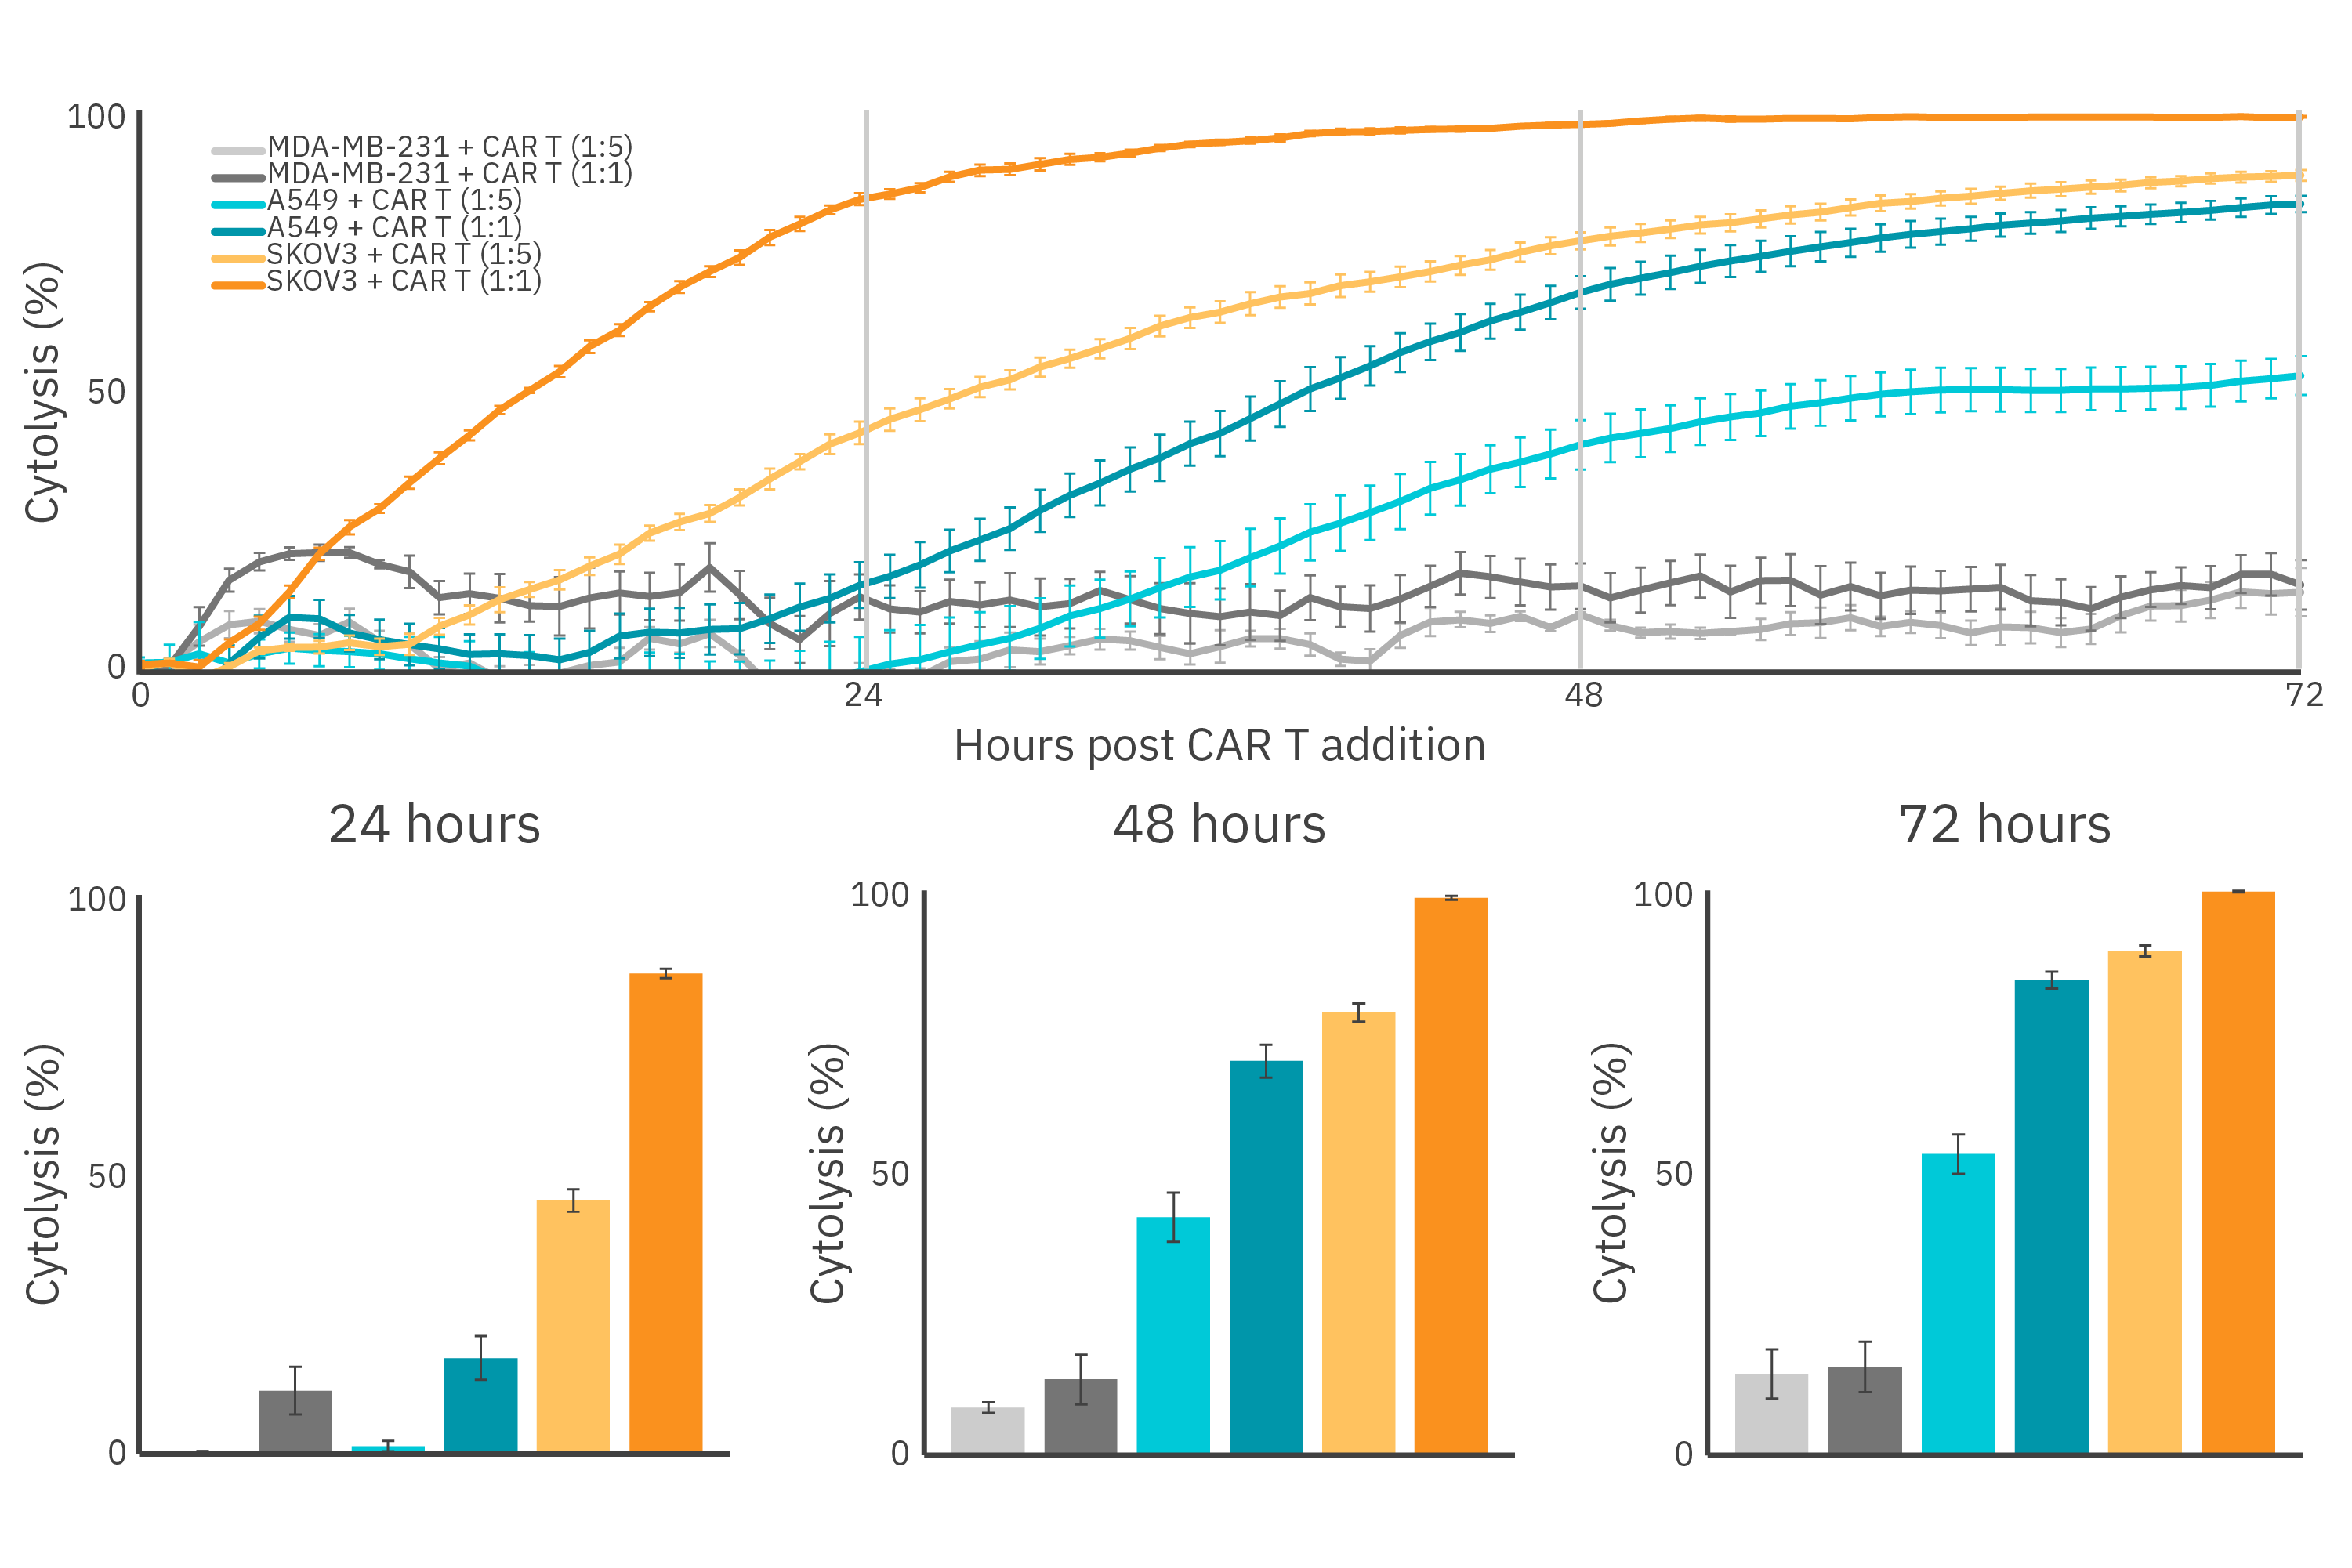
Real-time tracking shows immune cell mediated cytotoxicity is dependent on antigen density
The expression of the CAR within the immune cell population and its affinity for the target antigen are both important when determining the potency of a CAR T cell. Target cell lines presenting HER2 overexpression (SKOV3), HER2 low expression (A549), and no expression of HER2 (MDA-MB-231) were treated with HER2 CAR T cells, as the Maestro Z recorded continuously for 72 hours (Figure 1). As expected, complete killing was observed in SKOV3 cells at the 1:1 E:T ratio 72-hours post CAR T cell addition, while A549 cells exhibited only 80% cytolysis. Similar trends were observed for the 1:5 ED:T ratio in the HER2-expressing cell lines, with the extent of CAR T cell killing correlating directly with antigen expression. MDA-MB-231 cells showed 20% cytolysis in both 1:1 and 1:5 E:T conditions, most likely due to nonspecific killing by non-transduced T cells present, as approximately only 78% of the T cell population was CAR positive (Figure 2).
Target cell antigen density influences cytokine release
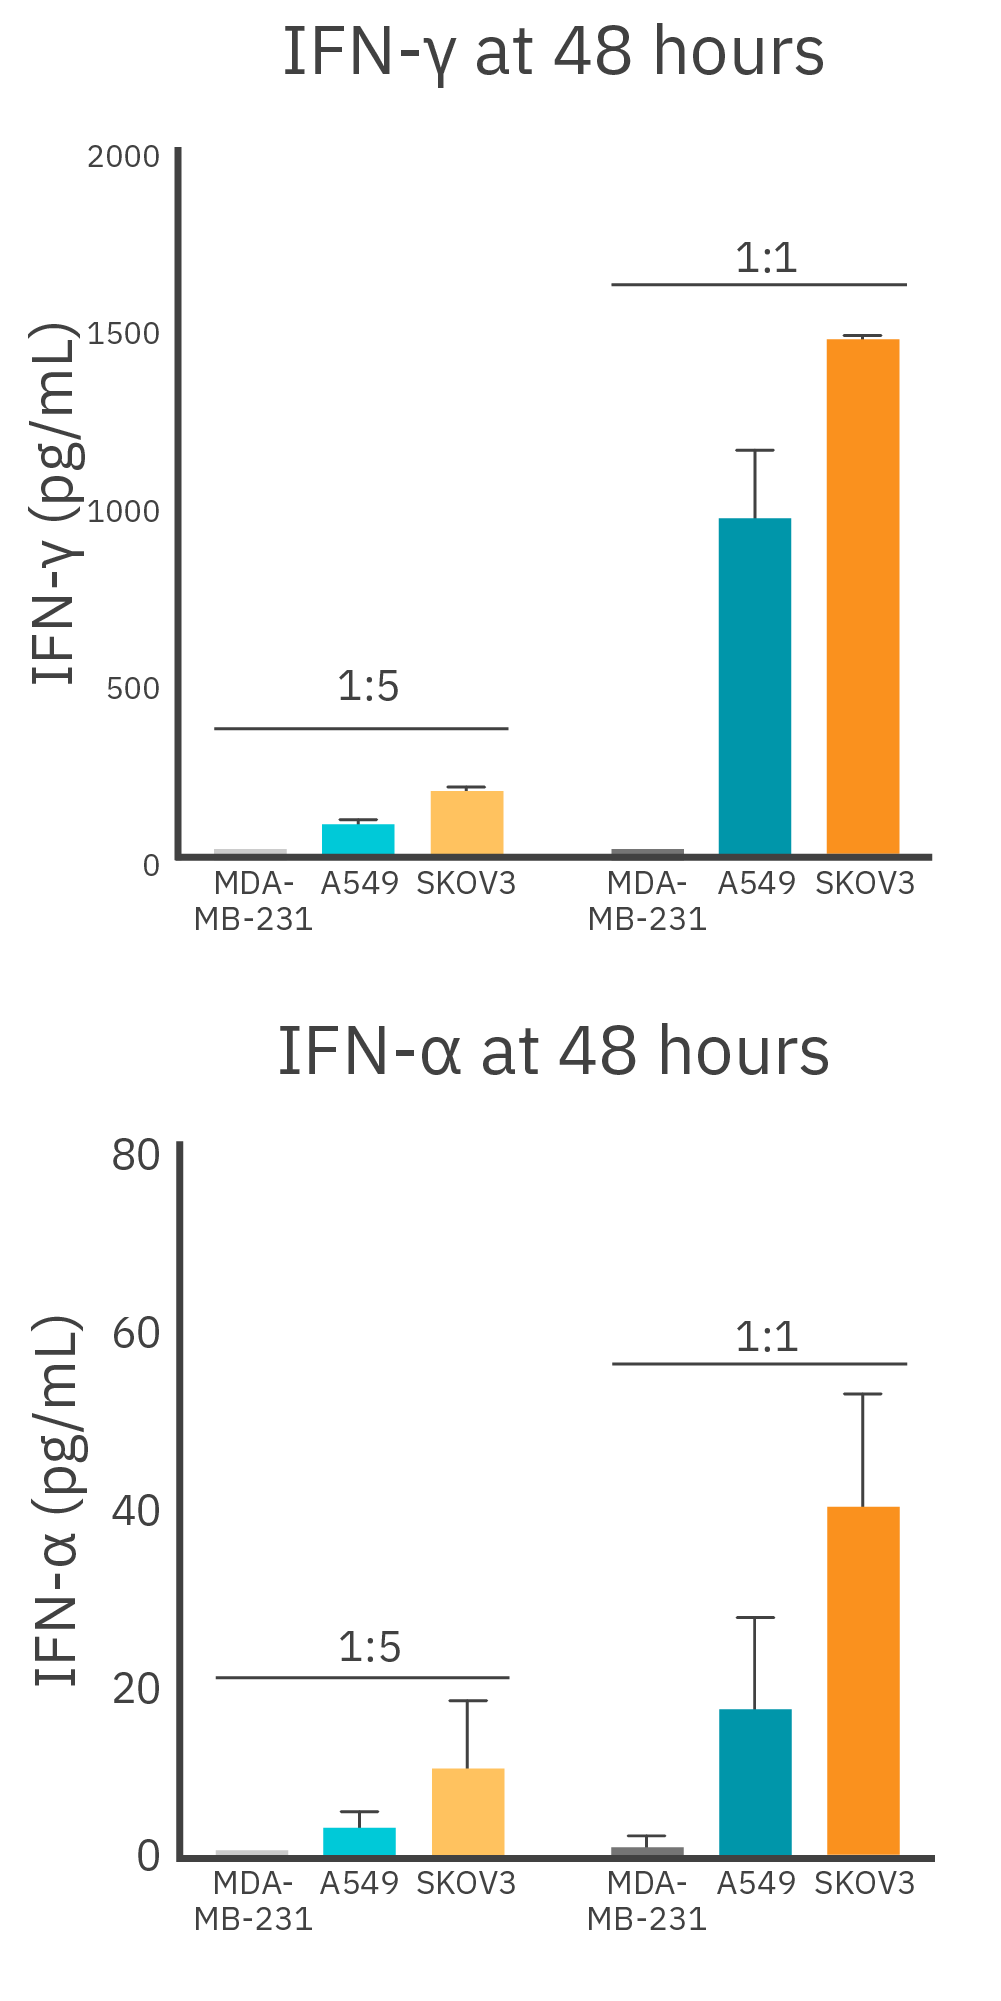
IFN-γ and TNA-α are both pro-inflammatory cytokines that play critical roles in the immune system. It has been shown that when simultaneously present, they induce a synergistic state that stimulates an anti-tumor response.4 To better understand the impact target antigen density had on cytokine release, we collected supernatant at 48-hours post-antigen exposure from SKOV3 (high HER2 expression), A549 (low HER2 expression), or MDA-MB-231 (no HER2 expression) cells co-cultured with CAR T cells (Figure 1).
At the 1:1 E:T ratio, CAR T cells co-cultured with SKOV3 had the highest IFN-γ production, releasing 41.6% more IFN-γ when compared to A549 cells (Figure 3 Top). The highest levels of TNF-α were detected from CAR T cells co-cultured with SKOV3 cells at the 1:1 E:T ratio, releasing approximately 80.5% more TNF-α when compared to CAR T cells co-cultured with A549 cells (Figure 3 Bottom). Similar trends were observed at the 1:5 ratio for SKOV3 and A549 cells, but with overall lower total cytokine secretion. As expected, CAR T cells cocultured with MDA-MB-231 cells did not release any detectable TNF-α or IFN-γ at either E:T ratio for the duration of the experiment.
Robust target cell cytotoxicity and IFN-γ release from HER2 CAR T cells when co-cultured with SKOV3 Cells
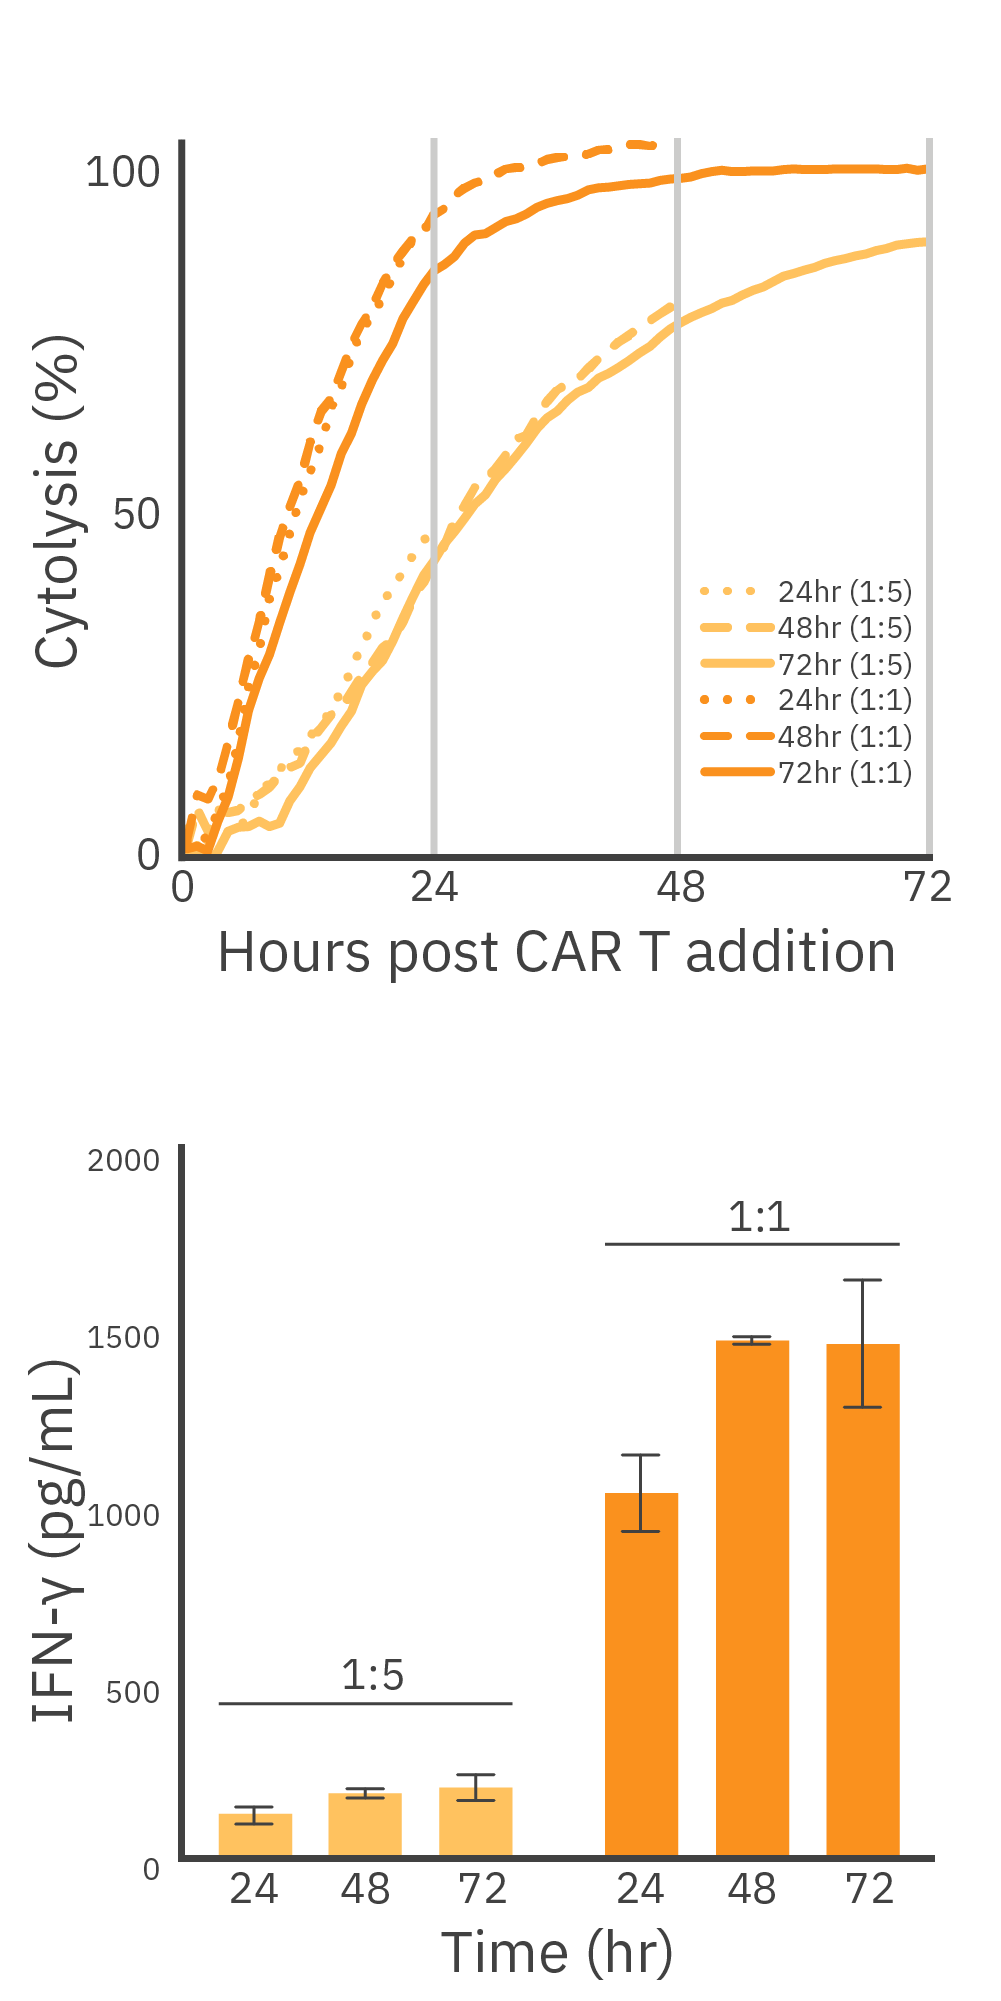
To measure how high levels of HER2 expression on target cells impacts CAR T cell-mediated cytotoxicity and cytokine release, we used HER2+ SKOV3 cells. Cells were seeded into three identical 96-well CytoView-Z plates, and after 24 hours, HER2 CAR T cells were added at E:T ratios of 1:5 or 1:1. Supernatant was collected at 24-, 48-, and 72-hours post CAR T addition for endpoint analysis. With the Lumit® IFN-γ (Human) Immunoassay kit.
We observed comparable measurements across the three identical plates, indicating consistent and reproducible values of %cytolysis and cytokine release. At the 1:1 E:T ratio, 94% cytolysis was reached 24 hours post CAR T cell addition with IFN-γ release measured at 1038.5 +/- 108.2 pg/ mL. The highest levels of IFN-γ production were measured at 72 hours, when SKOV3 cells reached 100% cytolysis, during which IFN-γ production increased by 33.7% from the 24-hour timepoint (Figure 4). Similar patterns were noted when the 1:5 E:T group reached near complete cell lysis (90%) at the 72-hour timepoint. IFN-γ production at 24 and 72 hours was 132.2 +/- 24.2 pg/mL and 209.5 +/- 35.2 pg/mL, respectively (Figure 4 Bottom). The parallel increase in both cytolysis and cytokine release suggests an effective activation of HER2 CAR T cells, highlighting their ability to induce target cell death while concurrently producing cytokines indicative of a potent immune response.
Conclusion
The Maestro Z allows for simple, noninvasive, real-time monitoring of immune cell-mediated killing of target cancer cells and provides a sensitive, quantitative assay for evaluating immune cell potency in vitro. Continuous monitoring of CAR T cell-mediated killing and measurement of cytokine release was demonstrated against different target cancer cell lines with varying HER2 antigen densities and across different E:T ratios, illustrating how Maestro Z assays can be multiplexed with Promega Lumit® Cytokine Immunoassays for a more comprehensive characterization of cell-based therapies. By applying the same principles demonstrated in this experiment, future work can continue to explore multiplexed potency assays for the evaluation of CAR T-cell therapies.
References
1. Ross J. (2021) Measuring real-time cell therapy potency with Bioelectronic assays
2. Majzner, R. G., et atl.(2020). Tuning the Antigen Density Requirement for CAR T-cell Activity. Cancer Discovery, 10(5), 702–723.
3. Santomassos B, et al. (2019) American Society of Clinical Oncology Educational Book 39: 433-444
4. Jorgovanovic, D., et al. (2020) Roles of IFN-γ in tumor progression and regression: A review. Biomarker Research, 8(1), 49.
Authors
Sierra Barnes1, Denise Sullivan1, Danielle Califano1, Stacie Chvatal1, Kim Haupt2, Dan Lazar2, Daniel Millard1
1Axion BioSystems, Atlanta, GA, USA
2Promega, Madison, WI, USA