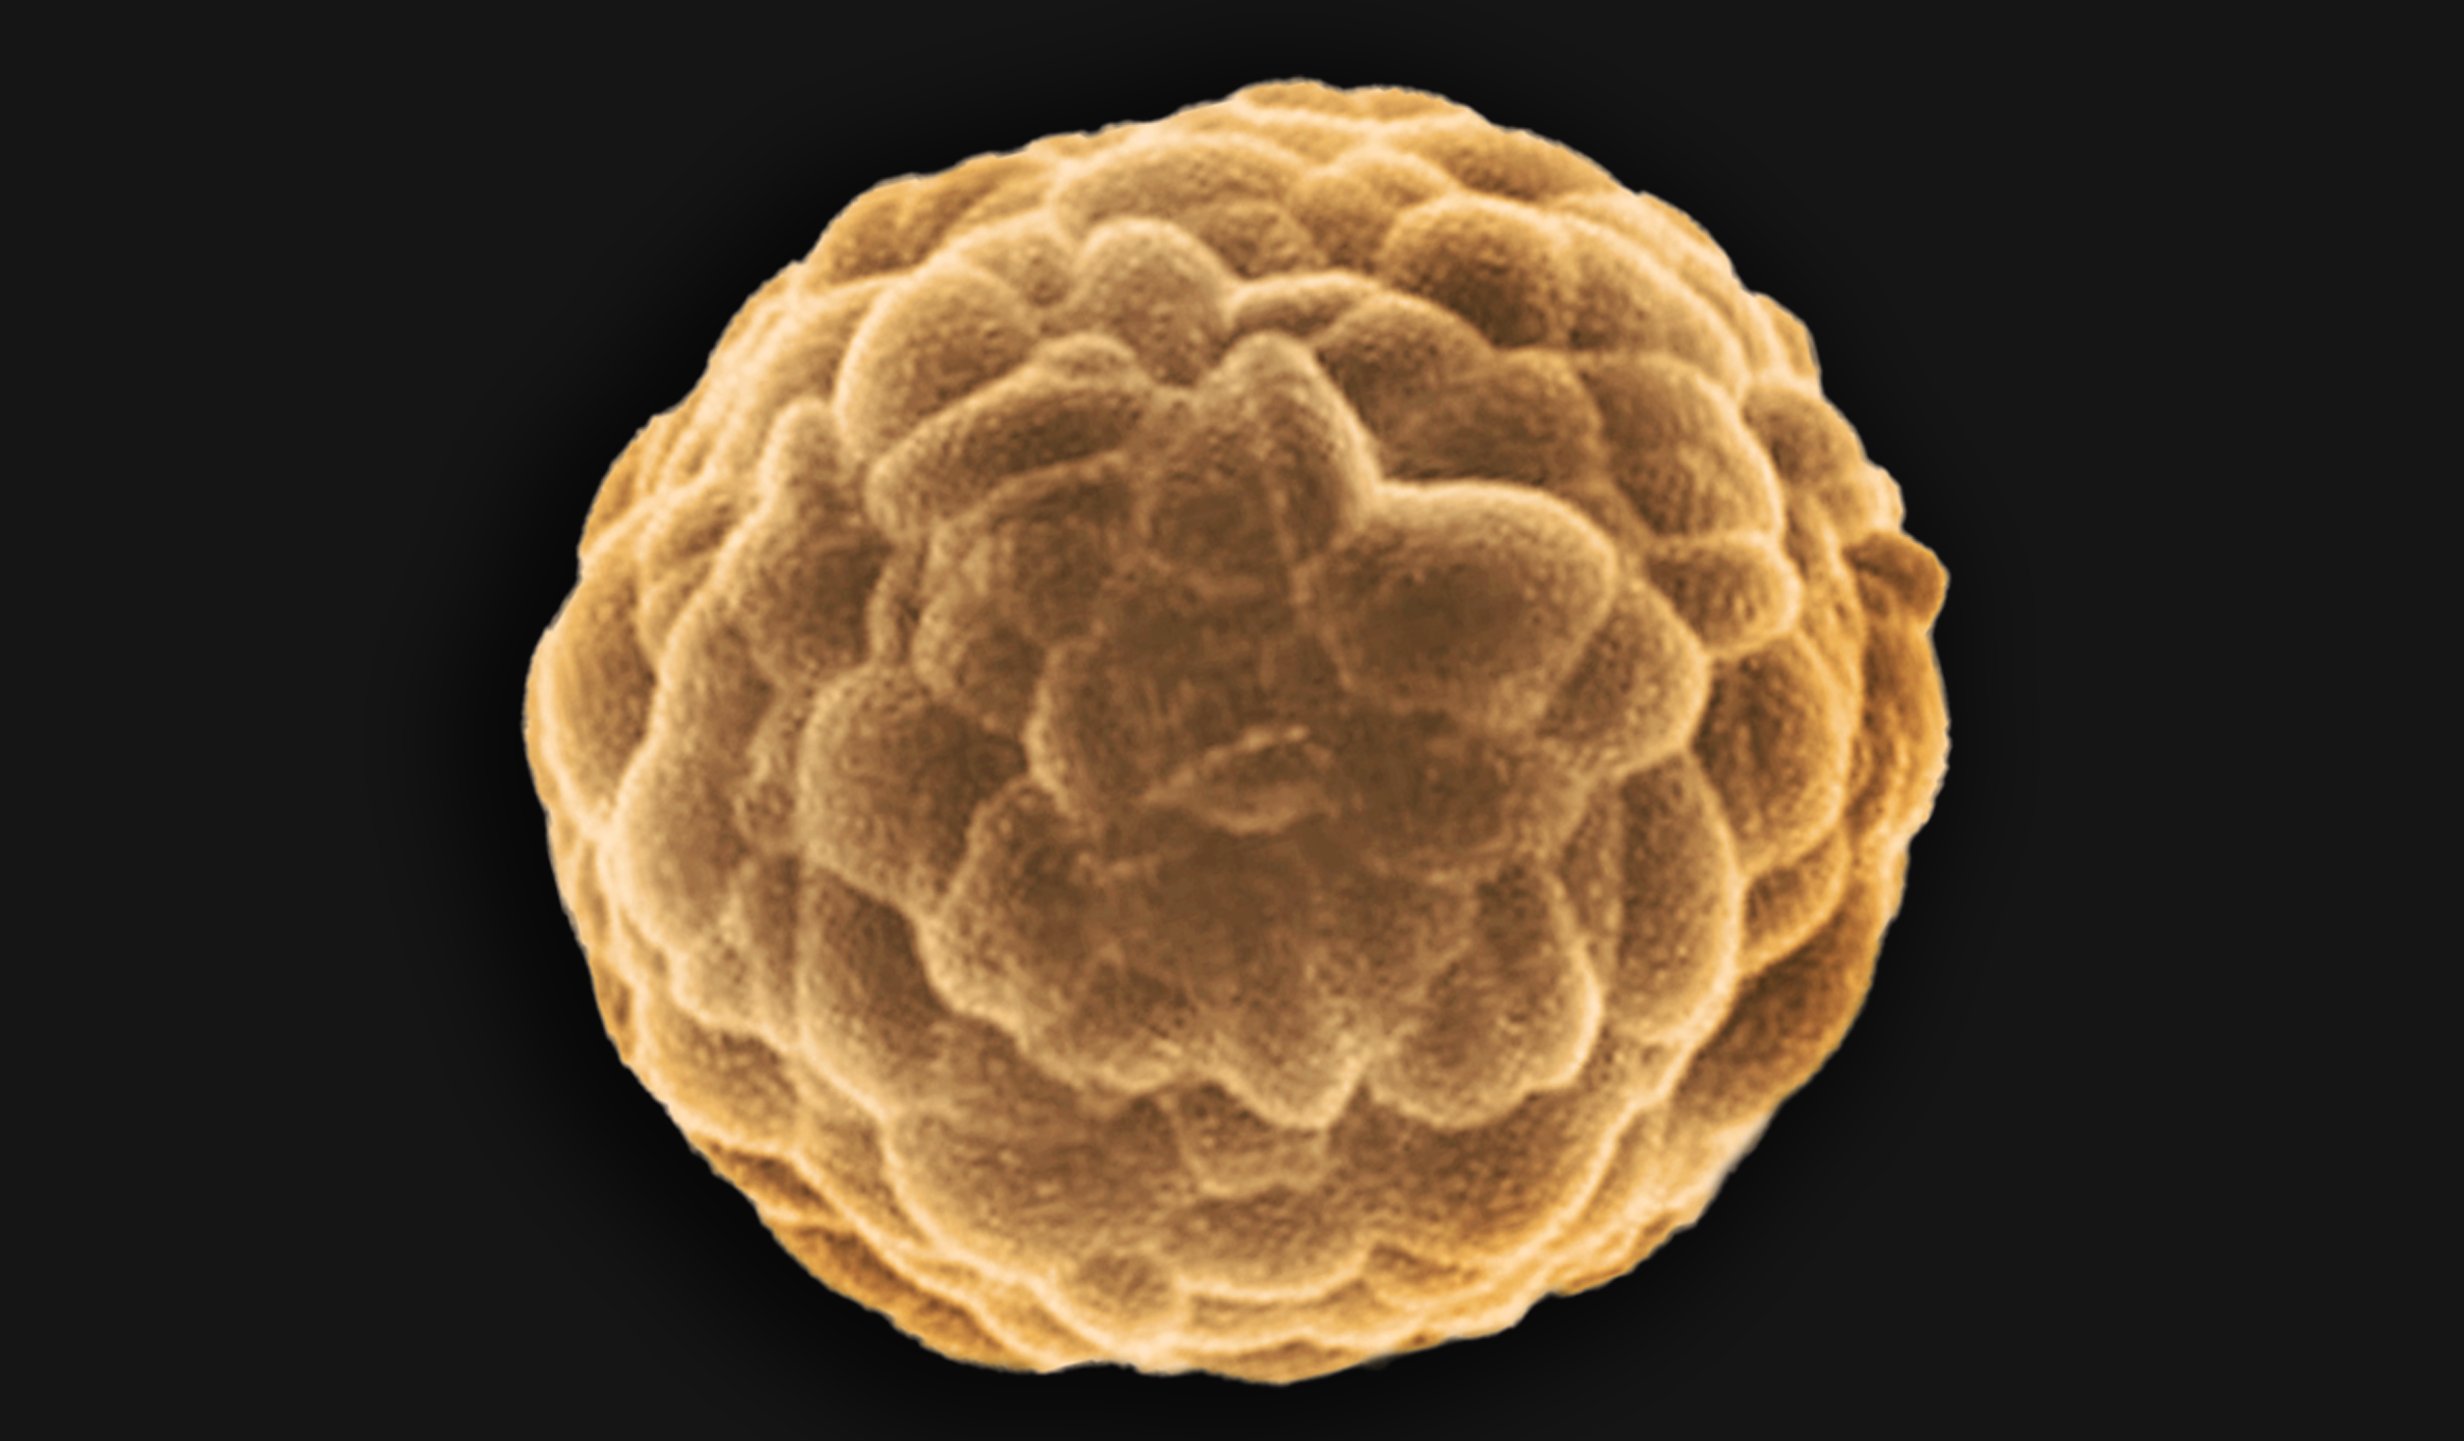
Cancer spheroids and tumoroids are versatile, three-dimensional (3D) in vitro models generated from cancer cells and tumor tissues. Because these 3D cancer models more closely resemble complex tumor biology and cellular interactions observed in vivo, scientists are using them to evaluate candidate immune cell products and accelerate preclinical drug development for urgently needed cellular immunotherapies in solid tumor applications. The simple and sensitive assays of the Maestro Z accurately measure tumor growth and immune cell killing of 3D cancer spheroid models.
The Challenge of Solid Tumors
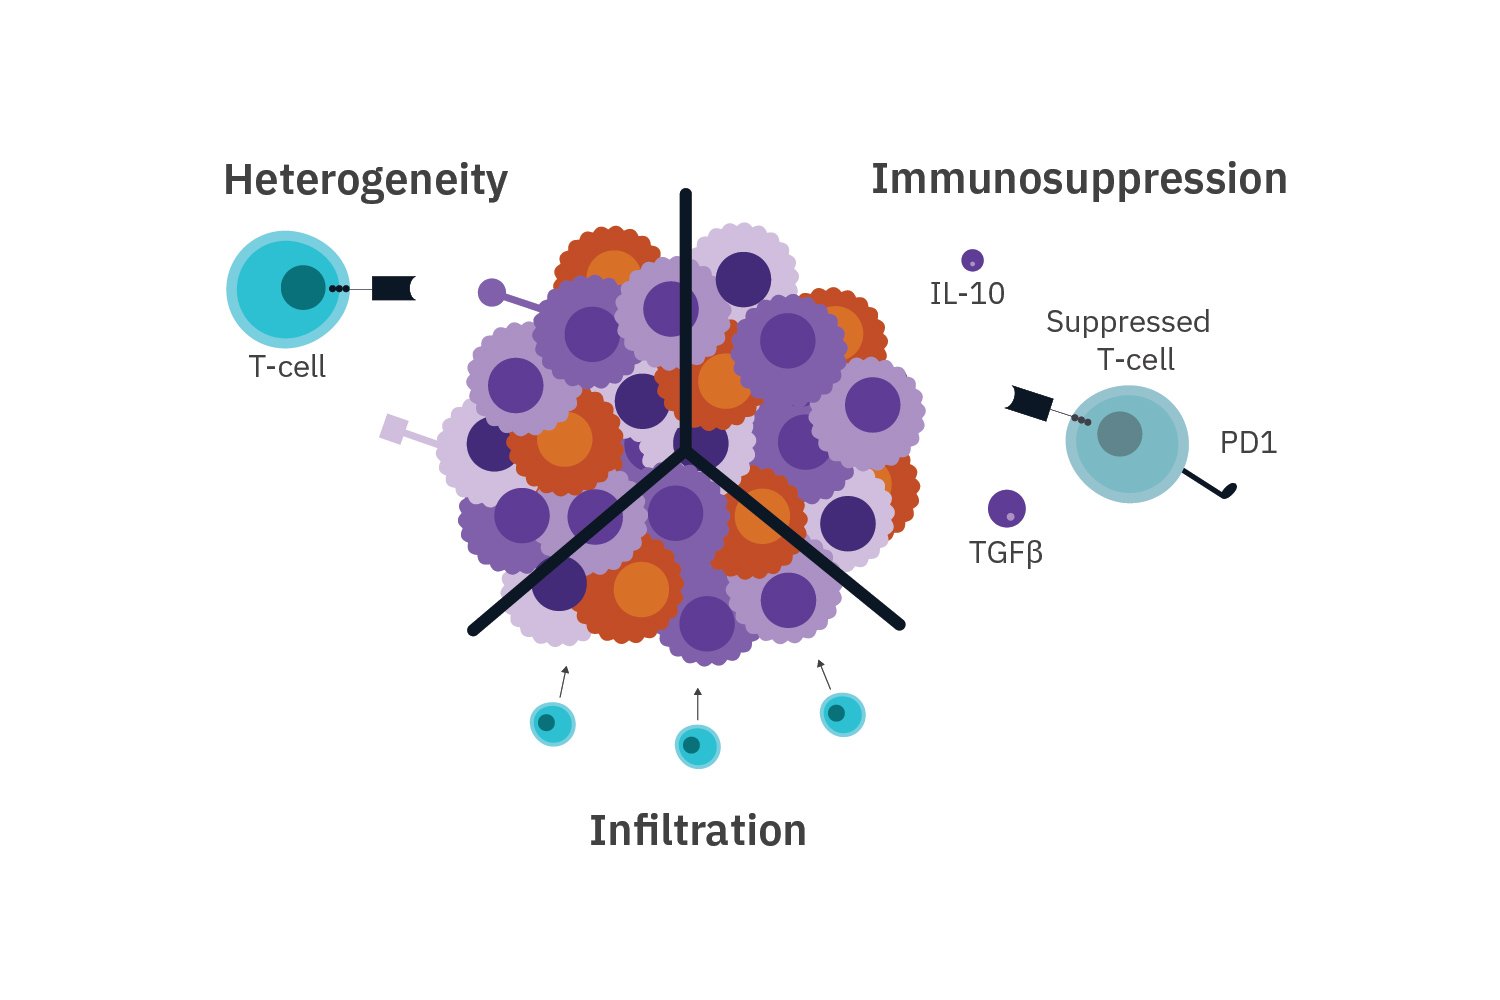
Heterogeneity
- Tumor heterogeneity can lead to acquired resistance through antigen escape.
Immunosuppression
- The tumor microenvironment (TME) can develop mechanisms to evade or suppress the immune response
- Tumor expression of PD-L1 can trigger the inhibitory PD-1 pathway
- Common immune-suppressive cytokines found in TME: IL-10, TGFB, IL-4, and IL35
Infiltration
- The composition and structure of tumors can prevent t-cell trafficking into the tumor.
Cancer Spheroid Assays
-
Live-cell imaging to measure spheroid killing with fluorescence>
-
Label-free impedance measures growth and immune cell killing in vitro>
-
Investigate immunotherapy potency on models that better reflect solid tumor biology>
-
Application Note: CAR-T Cell Potency Assessment with 3D Cancer Spheroid Models>
-
Assay Steps>
The Omni live-cell imaging platform combines detailed timelapse imaging and AI-driven analysis to track dynamic in vitro tumor killing from the incubator.
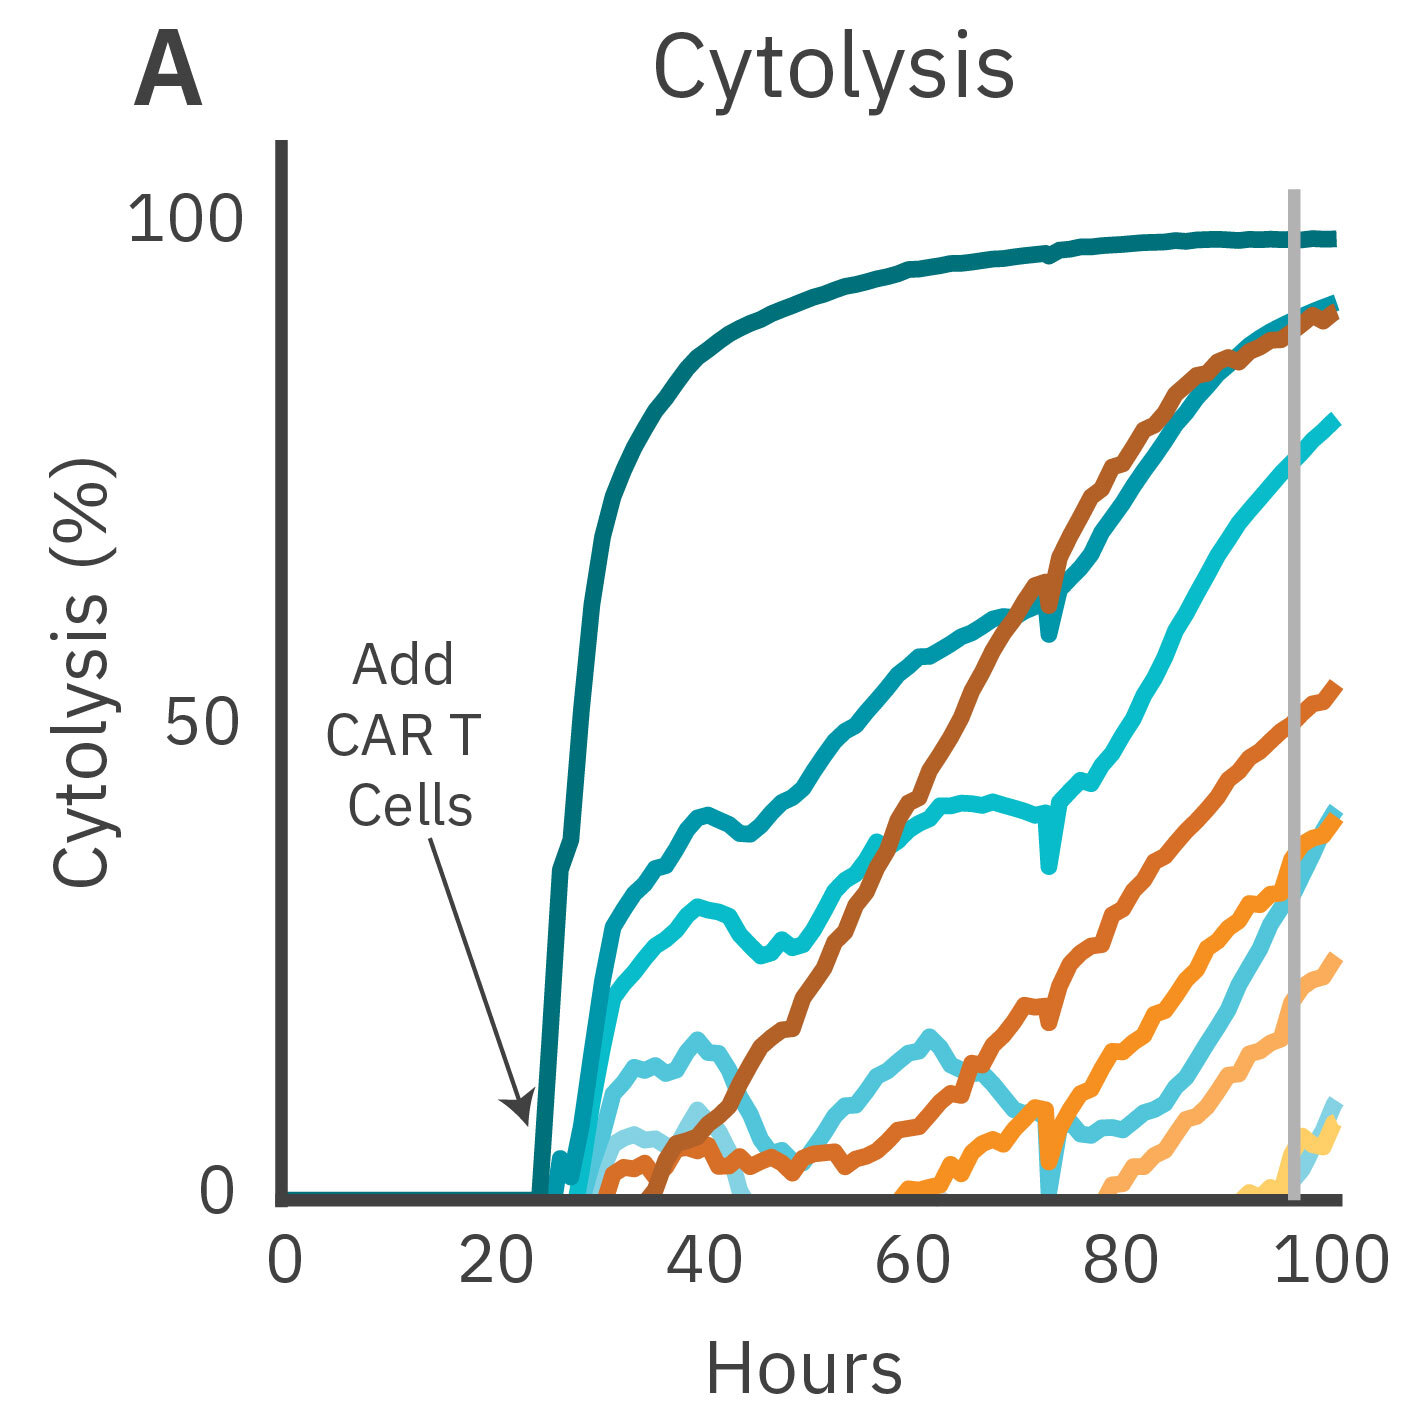
Purpose: To measure CAR T cell-mediated killing of cancer spheroids expressing different levels of HER2 antigen using live-cell imaging. Antigen receptor levels have been shown to influence CAR T cytolytic activity.
CAR T cells targeting HER2 antigen were added to spheroids derived from different cancer cell lines expressing GFP. Fluorescent live-cell imaging and quantification was performed by the Omni platform.
Result: CAR T cell-mediated killing was observed against both target cell lines and across different effector-to-target ratios as measured by GFP fluorescent intensity. The rates of cytolysis were directly proportional to the target antigen expression in each line.
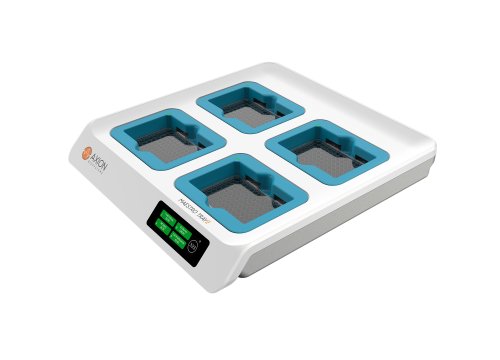
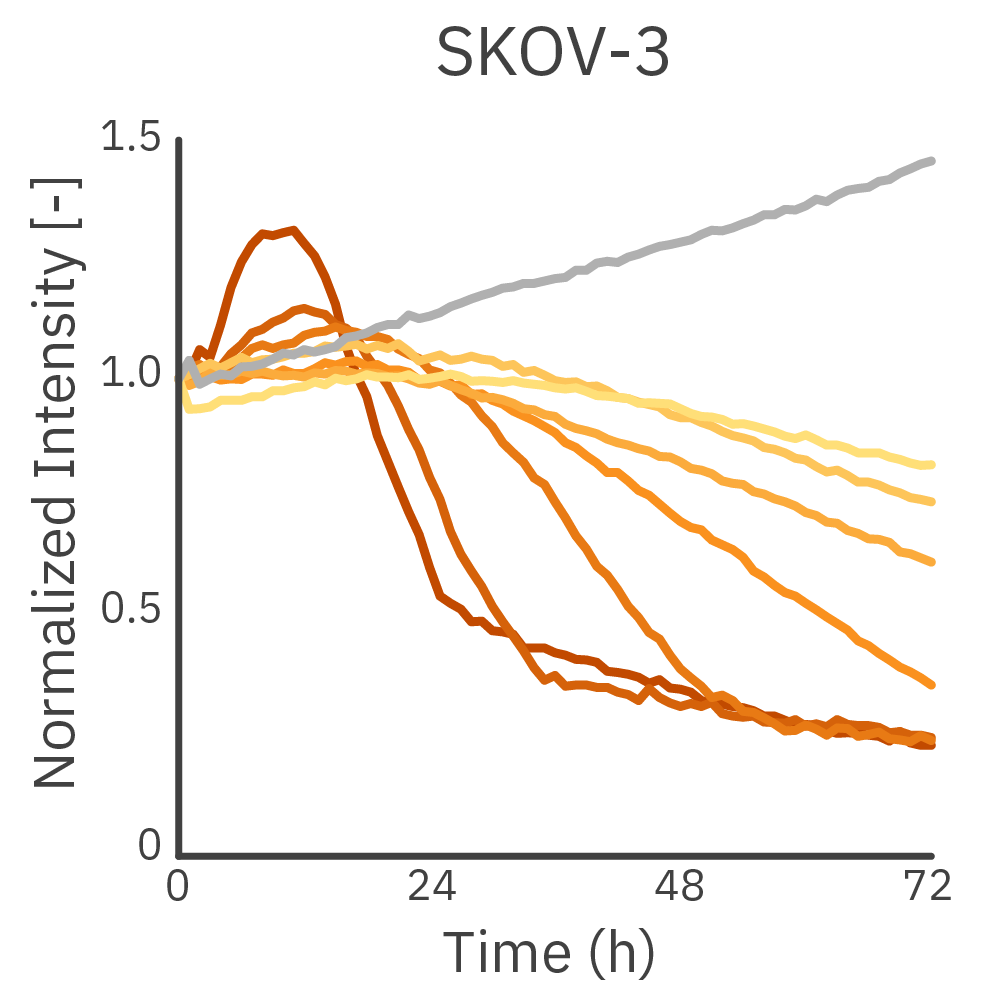
Accurately measuring cell potency is critical for developing and improving immunotherapies. Cancer spheroids placed in a CytoView-Z plate can be noninvasively monitored to track real-time growth and assess the potency of therapeutic candidates.
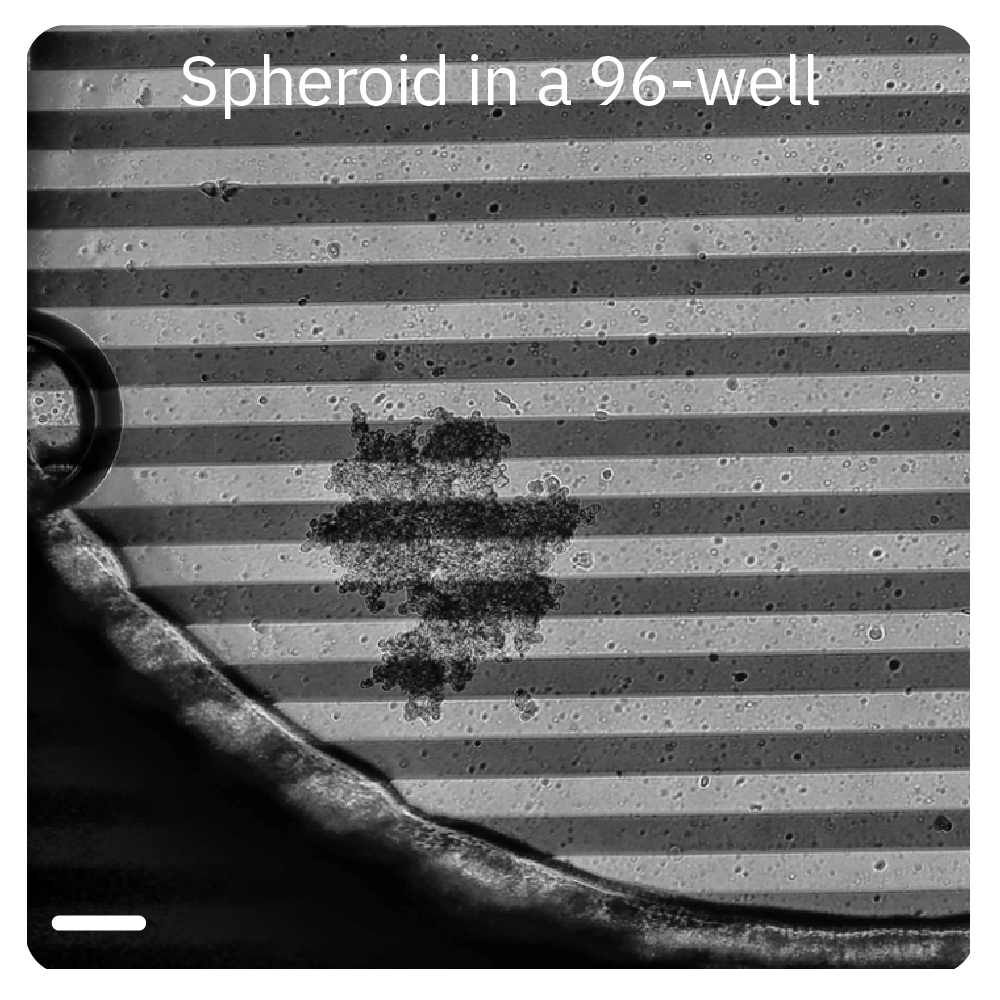
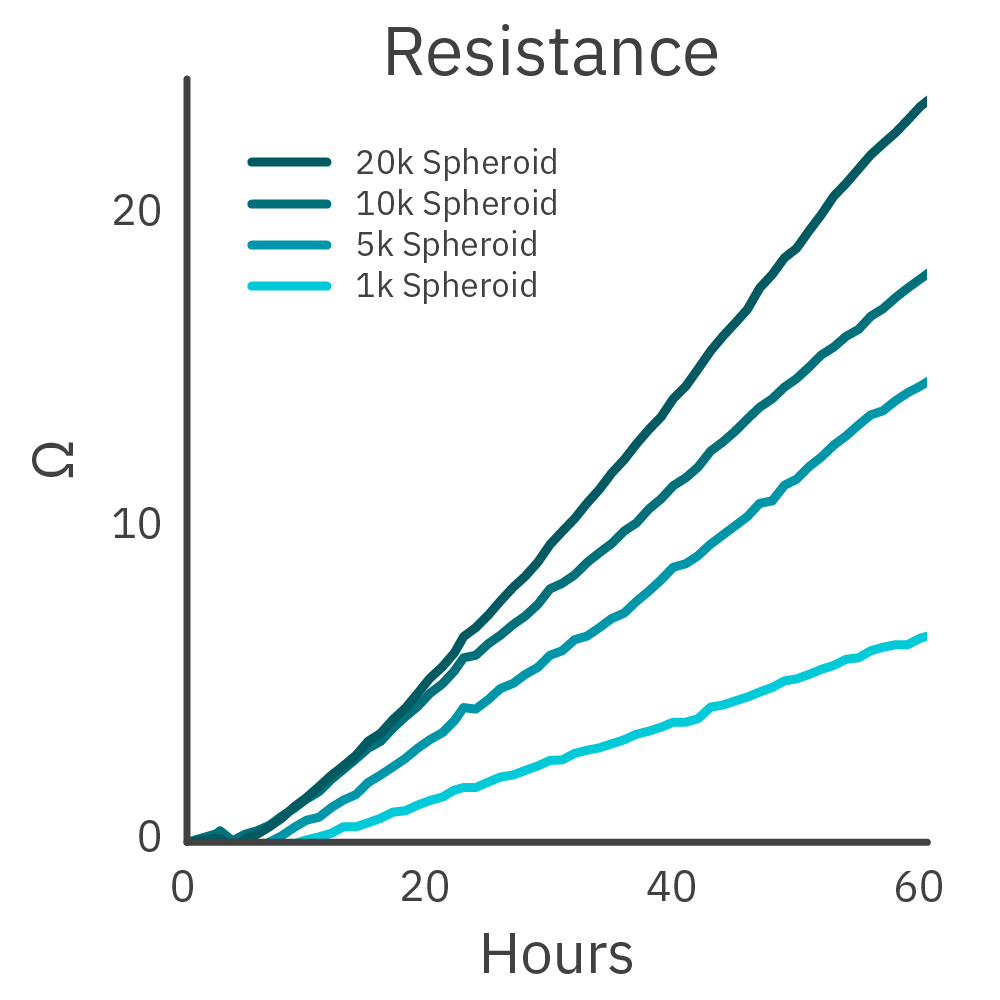

A cancer spheroid composed of HER2-expressing ovarian cancer cells in a CytoView-Z plate. Growth of spheroids of different starting sizes are monitored over 60 hours. The addition of HER2-targeted CAR T cells at different effector:target ratios at 24 hours shows a dose-dependent decrease in spheroid size.
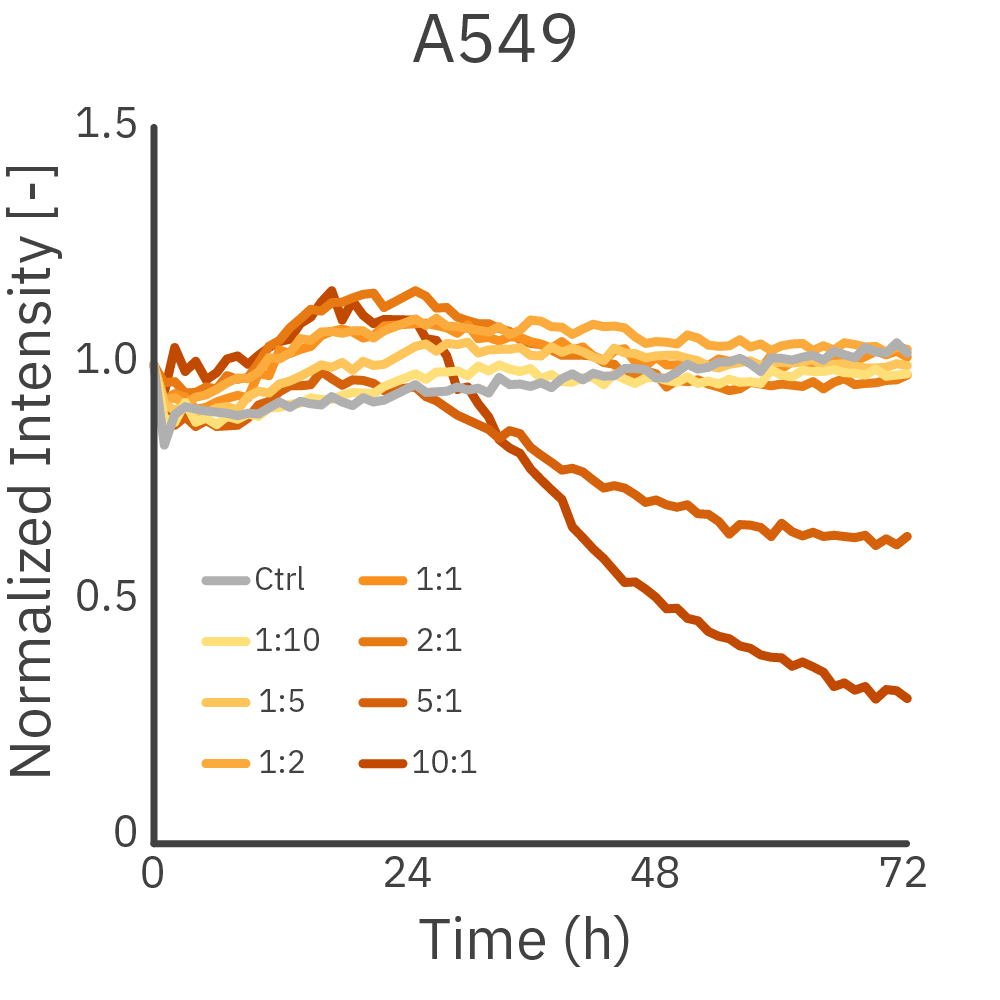
Solid tumors are characterized by a harsh tumor microenvironment, which can substantially impact interactions between tumors and immune therapies like chimeric antigen receptor (CAR) T-cell therapy. While two-dimensional (2D) cell cultures remain an indispensable platform for high-throughput drug screening and toxicity testing in oncology, 3D cancer spheroids offer an in vitro model closer to the complex tumor biology. A comparison of CAR T cell-mediated cytolysis in 3D in vitro models and 2D monolayers using the Maestro Z found a decreased potency of HER-2 specific CAR T cells in the 3D tumor model- much as solid tumors demonstrate increased resistance to treatment in vivo.
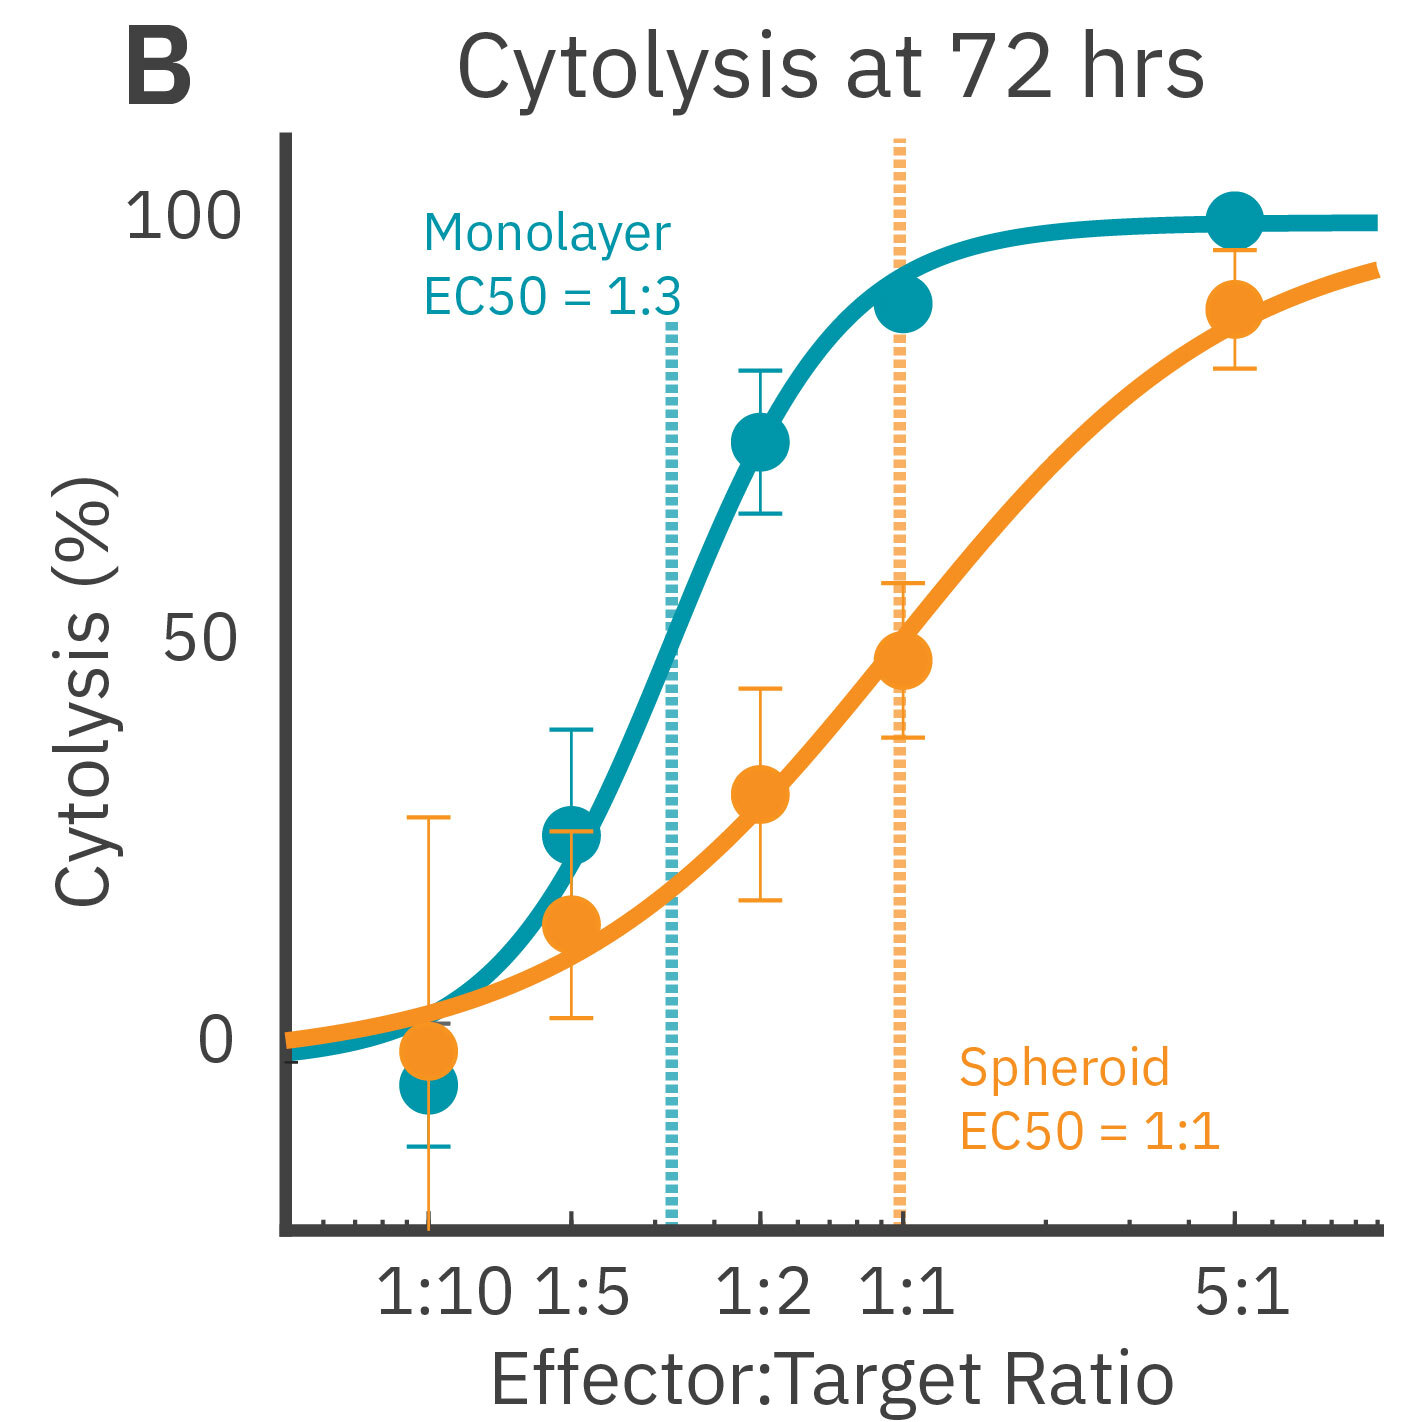
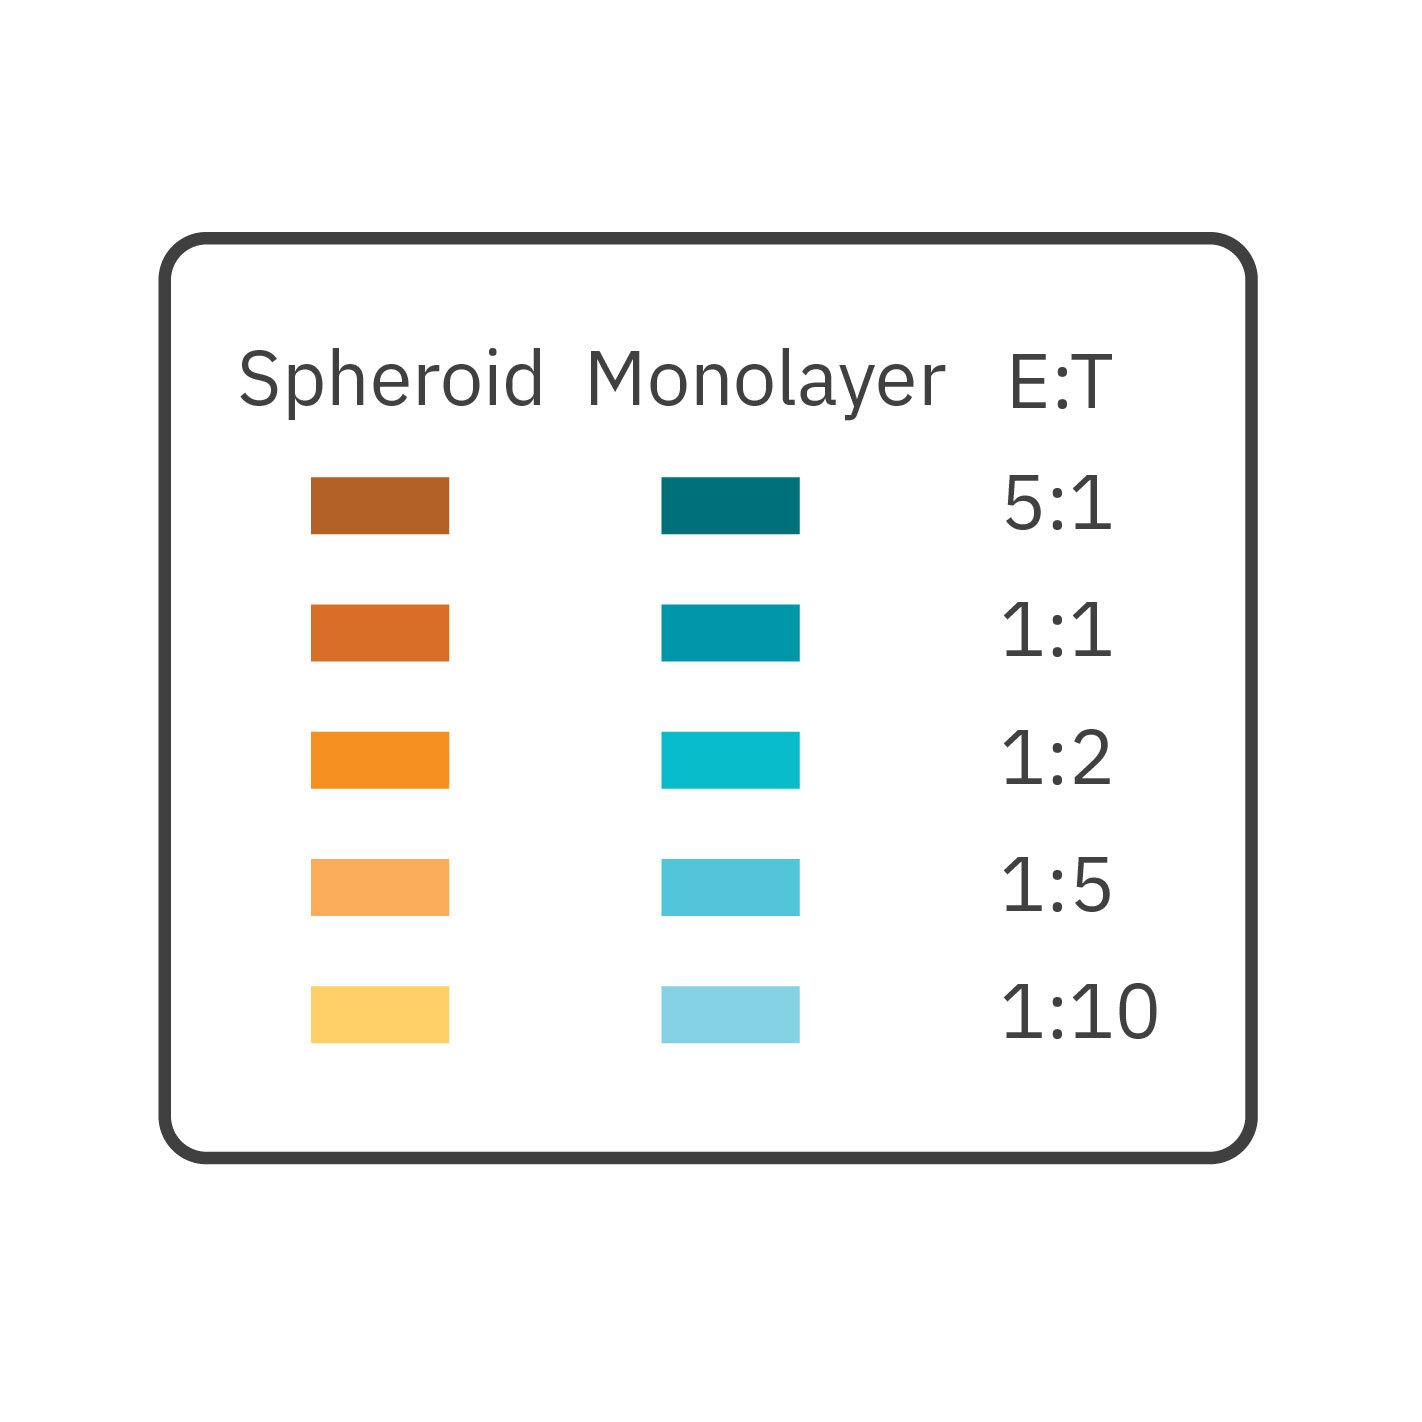
CAR T cell-mediated cytolysis of cancer spheroids is lower than the cytolysis of matching E:T ratios in monolayer cultures over time (A), resulting in a higher EC50 for the spheroid cultures (B).
Application Note:
CAR-T Cell Potency Assessment with 3D Cancer Spheroid Models
When it comes to measuring the effects of cell-based immunotherapies on solid tumors, 2D monolayers may not tell the full story. Download our new app note to discover how next-generation in vitro tumor models on Axion's Maestro Z platform can accelerate immunotherapy discovery—with no labels, dyes, or complicated steps.
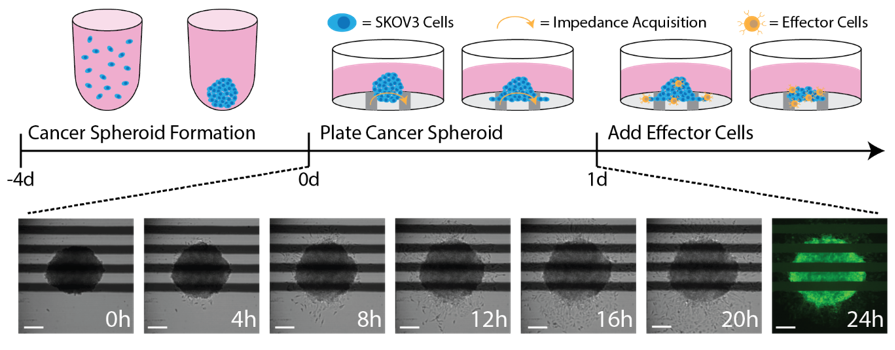
Cancer spheroids are formed over four days in ulta-low attachment U-bottom plates. Individual spheroids are then transferred into each well of a CytoView-Z plate. One day post spheroid plating, CAR T cell suspension is added at desired effector to target (E:T) ratios. Changes in spheroid size are tracked label-free and in real time with the Impedance Module software.
Additional cancer spheroid culture and recording protocol is available.