Publication
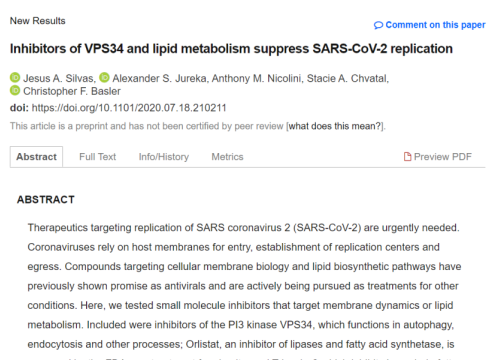
Inhibitors of VPS34 and lipid metabolism suppress SARS-CoV-2 replication
Author:
Williams CG, Silvas JA, Jureka AS, Nicolini AM, Chvatal SA, Carlson-Strevermer J, Oki J, Holden K, Basler CF.
Product:
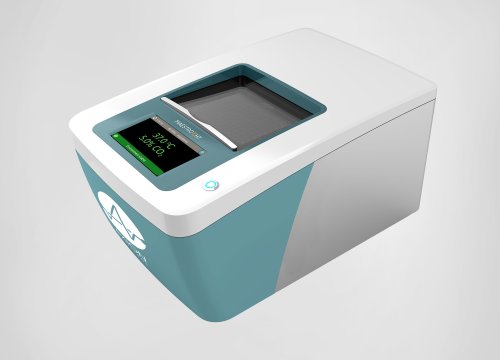
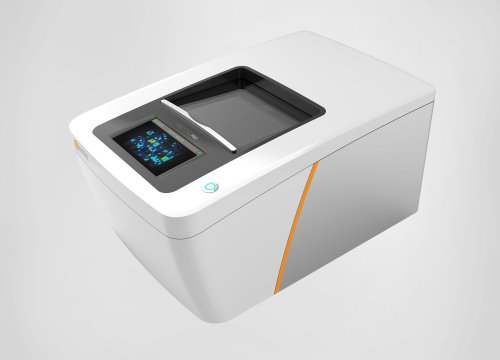
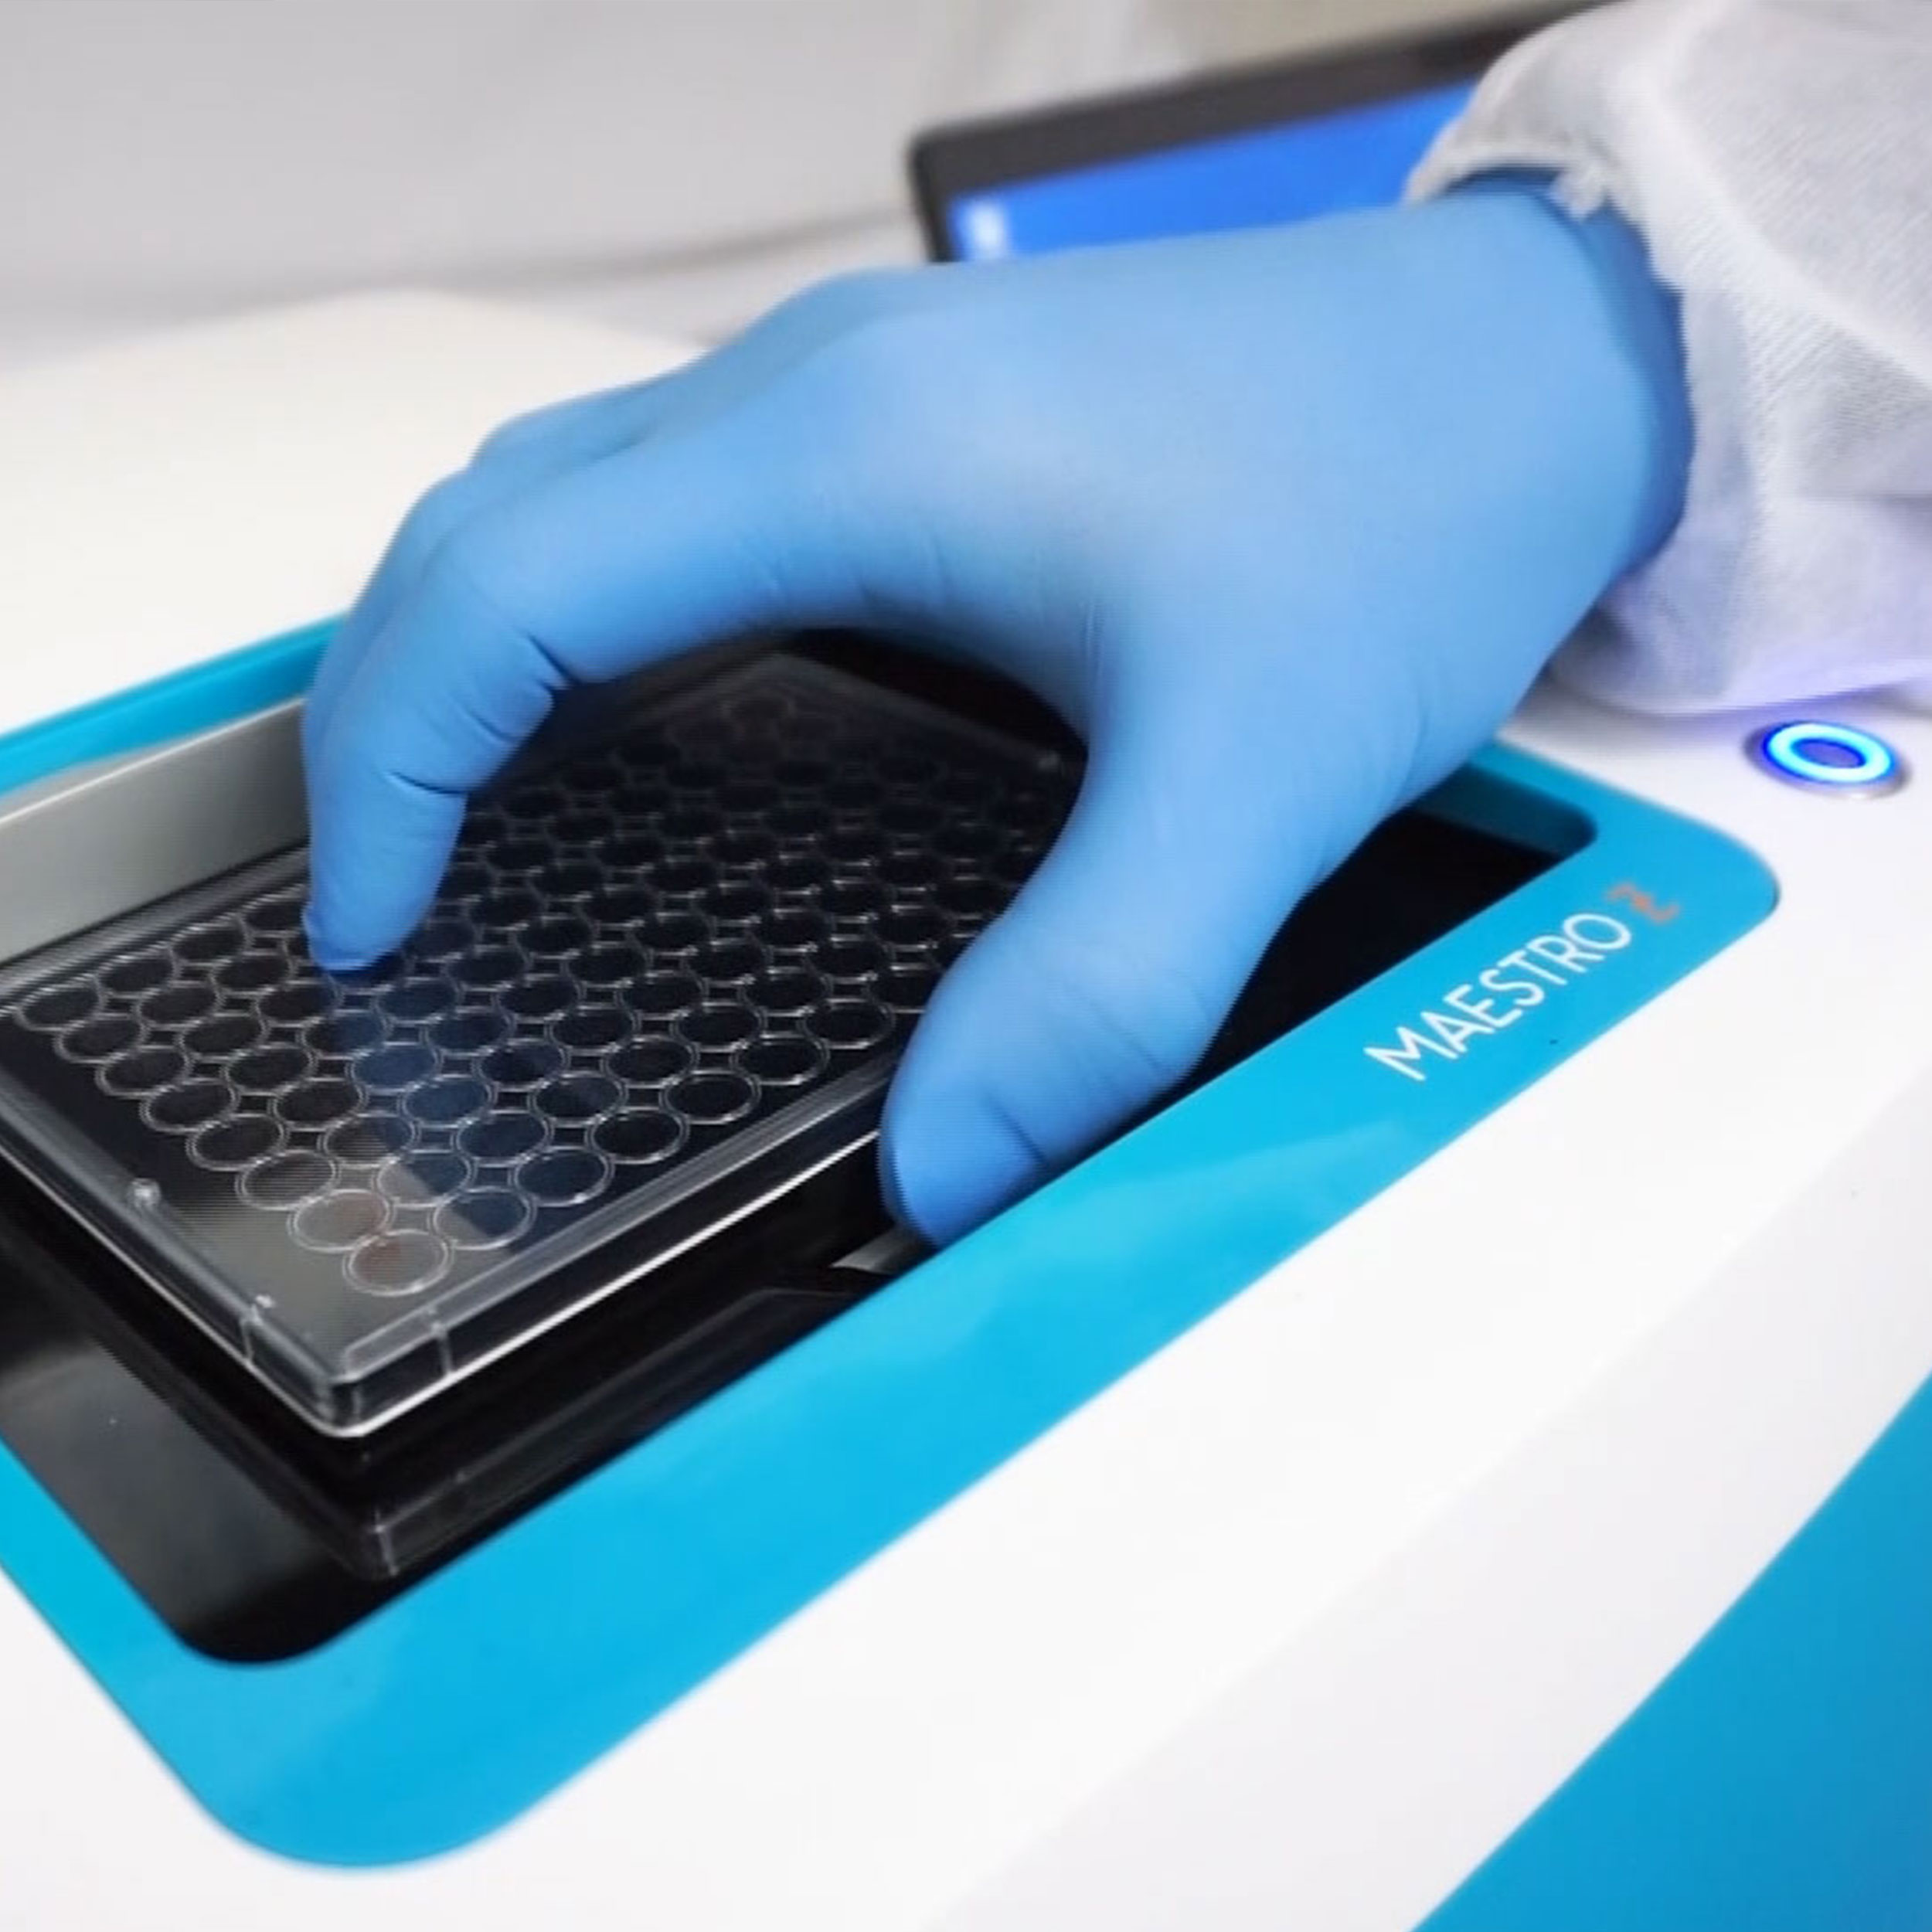
Maestro Z,
インピーダンスモジュール,
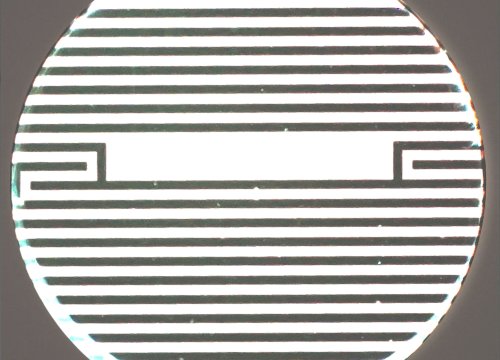
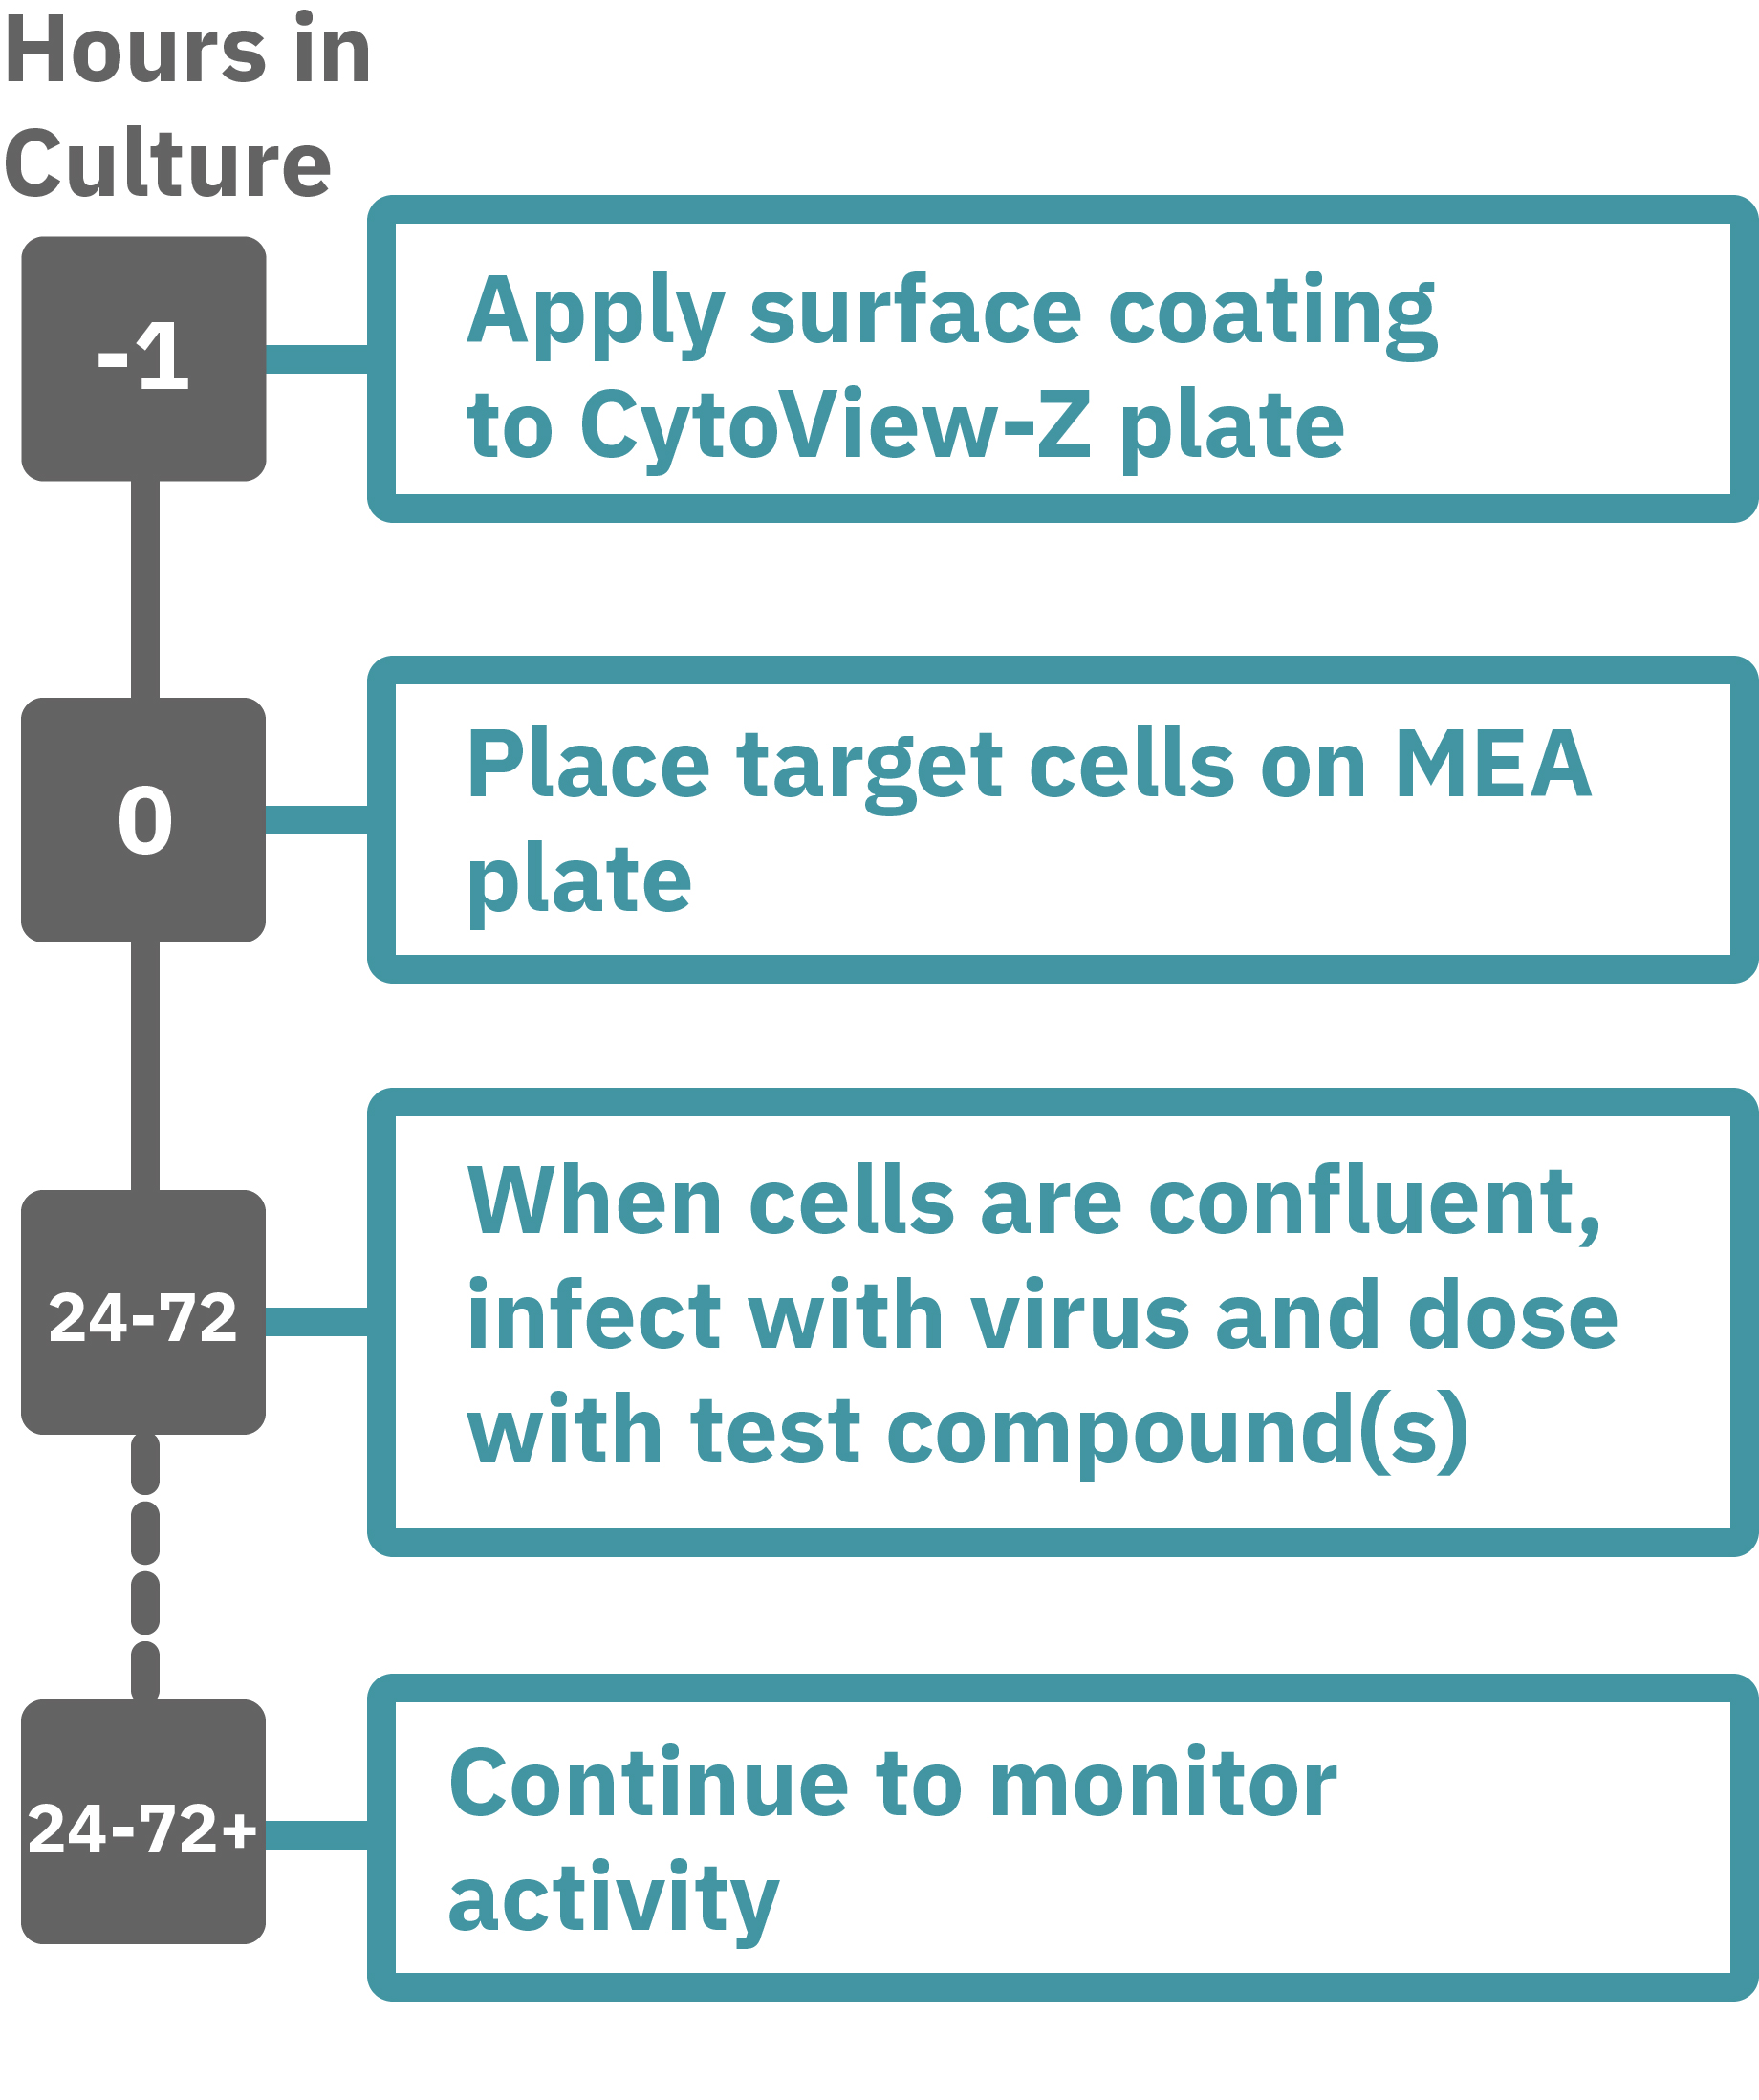
CytoView-Z プレート,
Maestro Pro,
Maestro Edge,