Product Brochure
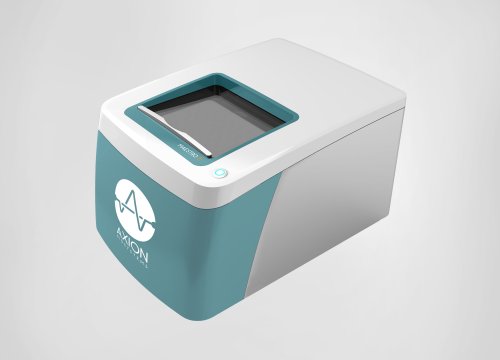
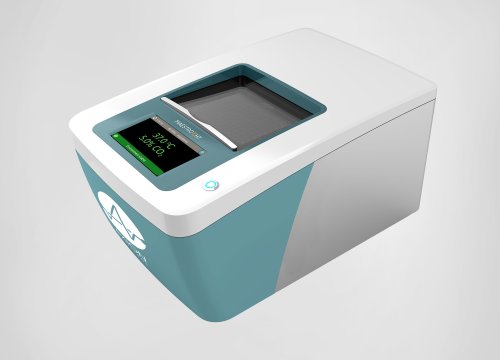
Maestro Z - Brochure
Author:
Axion BioSystems
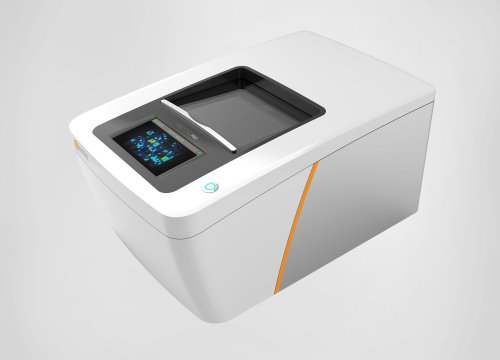
Product:
Maestro Z,