When is Spike Sorting helpful?
- Assays with multiple cell types with distinct response properties (e.g. genetically modified and control neurons)
- When cells do not form synapses with each other, such that each cell acts independently (e.g. sensory neurons)
Introduction to spike sorting for microelectrode arrays
When cell coverage is sufficiently dense, each electrode in Axion’s microelectrode arrays can detect spiking from multiple nearby neurons. For some applications, identifying the source of each spike can provide insight into how different neurons participate in the network and respond to compounds or stimulation. Spike sorting is a computational method that groups spike waveforms based on shape to identify the putative source neurons, or unit. For spike sorting, Axion recommends Plexon’s Offline Sorter TM and subsequent unit-based analysis in the Neural Metric Tool. This protocol outlines this process.
Generate AxIS Spike (.spk) file in AxIS Navigator
-
In AxIS Navigator, open the .raw file of interest. Right click on the .raw file and select Configuration → Spontaneous, Electrically Evoked, or Optically Evoked depending on whether your file includes stimulation. Note: To process more than one file at a time, select File → New Batch Process.
-
Optional: Double click on the Spike Detector. Change the detection Method to Peak Detection Adaptive Threshold (recommended) or Peak Detection Static Threshold. These methods align spike waveforms at their peak, which can result in fewer redundant units after spike sorting.
-
In the Experiment Setup panel, ensure that the AxIS Spike file is selected for recording in the Spike Detector drop-down. Press Record. This will generate a .spk file in the specified Recording Folder.
Convert AxIS Spike (.spk) files to .nex files in the Axion Data Export Tool
Converting .spk files to .nex files using the Axion Data Export Tool is important to preserve the metadata, such as stimulation events and plate type. Directly loading .spk files into Plexon’s Offline Sorter TM will result in data corruption.
-
In the Axion Data Export Tool, select the Export .spk to .nex tab and load your .spk file(s).
- Optional: Enter a start and end time (in seconds) into the Start Time and Stop Time fields, respectively. Leave these fields empty to export the whole file(s).
-
Click Export. A .nex file will be saved for each .spk file in the same directory as the source .spk file(s)
Perform spike sorting in the Plexon Offline Sorter
The Offline Sorter TM offers multiple algorithms for spike sorting, including automatic, manual, and template-based methods. For details on these algorithms, see the Offline Sorter TM manual. The example in Figures 2 and 3 uses T-Distribution E-M automatic sorting, but the best sorting method will depend upon your cell type and application.
-
In the Offline Sorter TM , select File → Open to load the .nex file. Note: Change the file drop-down to NeuroExplorer (*.nex) to enable selection of .nex files.
-
In the Control Grid, change the Channel drop-down to any channel of interest to enable sorting options.
-
The Sort menu offers multiple algorithms for spike sorting. For automatic sorting, select Sort → Perform Automatic Sorting. Under Which Channels, select All Channels in Spike Source to ensure that all channels are processed. Select the desired algorithm and click Ok.
-
Optional: Once sorting is complete, use the Waveforms and Units menu to modify the sorting results.
-
Select File → Export to .NEX to save the sorted spike data to a .nex file for analysis in the Neural Metric Tool. Be careful to name your .nex file to distinguish the sorted .nex from the original .nex file.
Analyze sorted spikes in the Neural Metric Tool
-
In the Neural Metric Tool, click File → Load → Load Plexon Sorted Spikes File (.nex) to load the sorted .nex file.
-
All analyses are performed on a per-unit basis and well metrics are averages across units in each well. The Plate Map section displays the selected metric across wells. The Bursting, Synchrony, and Evoked or Average Network Burst sections display the well selected in the Plate Map. Rasters display spikes from individual units (i.e. neurons), with each row representing a single unit.
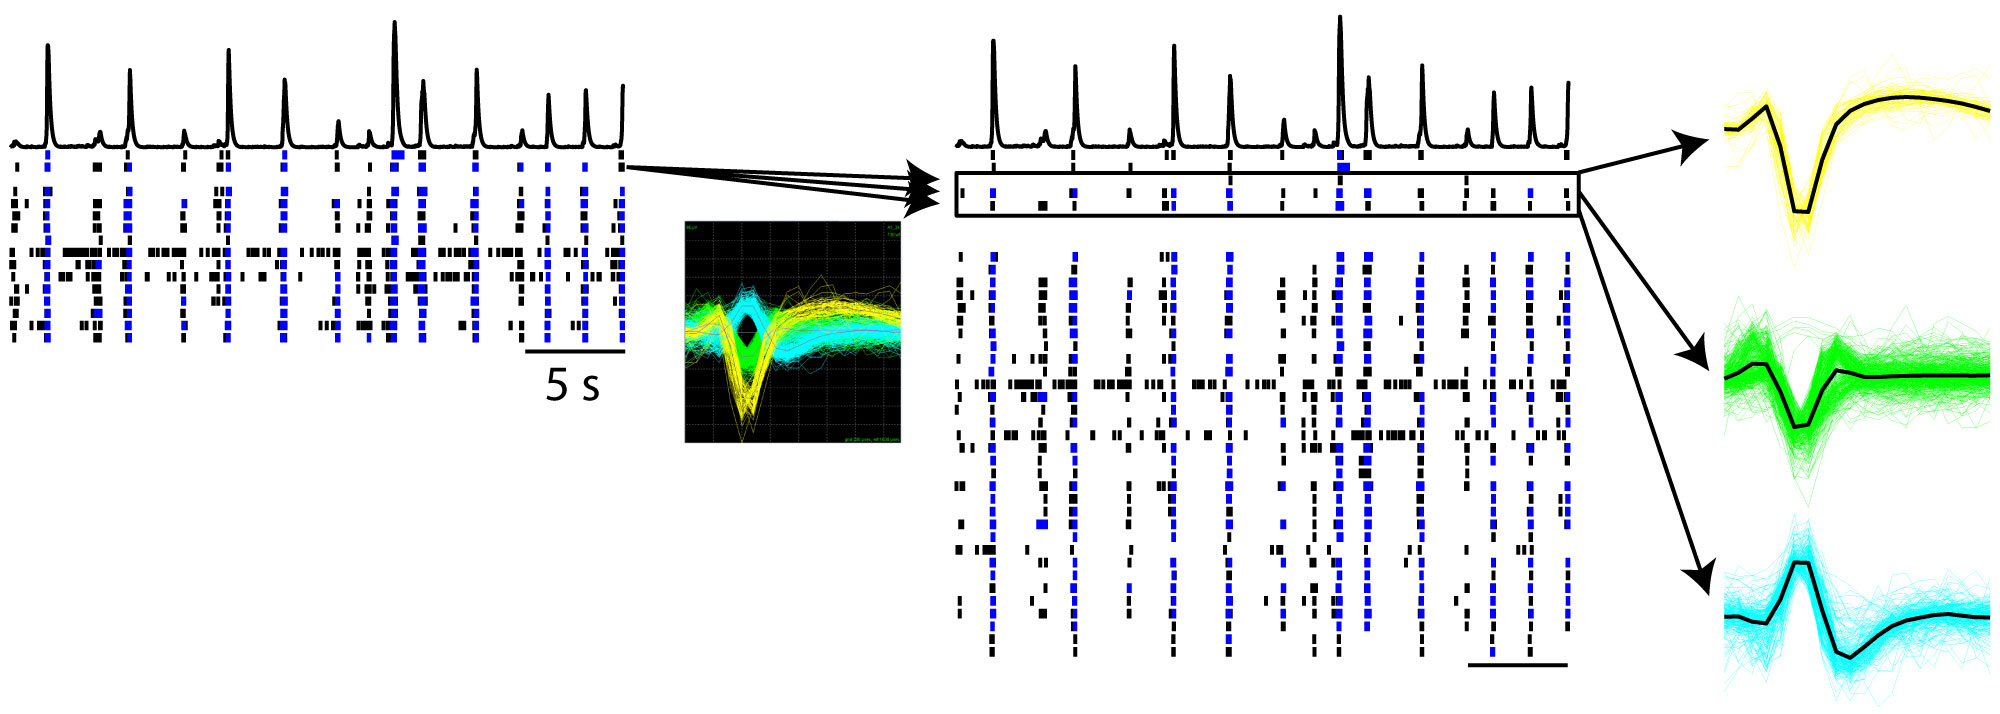
Spike sorting provides high resolution rasters in the Neural Metric Tool
Primary rodent cortical neurons were seeded at 50k cells/well on a CytoView MEA 48 well plate. At DIV 28, spontaneous activity was recorded. To determine the contribution of individual neurons to network activity, spikes were sorted using the T-Distribution E-M automatic sorting method in the Offline Sorter TM . The resulting .nex file was loaded into the Neural Metric Tool. The left raster shows the spiking activity of each electrode as a row, with each spike marked by a tick. Spike sorting identified multiple units (i.e. neurons) per electrode. The right raster displays the spiking activity of each unit, providing higher resolution and insight into the contribution of individual neurons to network activity. On the far right, the spike waveforms for the three units detected on a single electrode are overlaid with the average waveform plotted in black.
-
Adjust the analysis settings as needed using the Analysis Parameters, Burst Parameters, Synchrony Parameters, and Evoked or Average Network Burst Parameters sections.
-
When satisfied with the analyses, export figures using the Copy button in each panel.
-
Export the unit- and well-based metrics by clicking File → Export → Export Recommended Metrics to CSV, Export Supplemental Metrics to CSV, or Export Metrics to Matlab File.
-
Optional: The recommended and supplemental metrics CSVs are compatible with the AxIS Metric Plotting Tool, This tool allows metric comparisons across treatments, time points, and files to create publication ready figures.
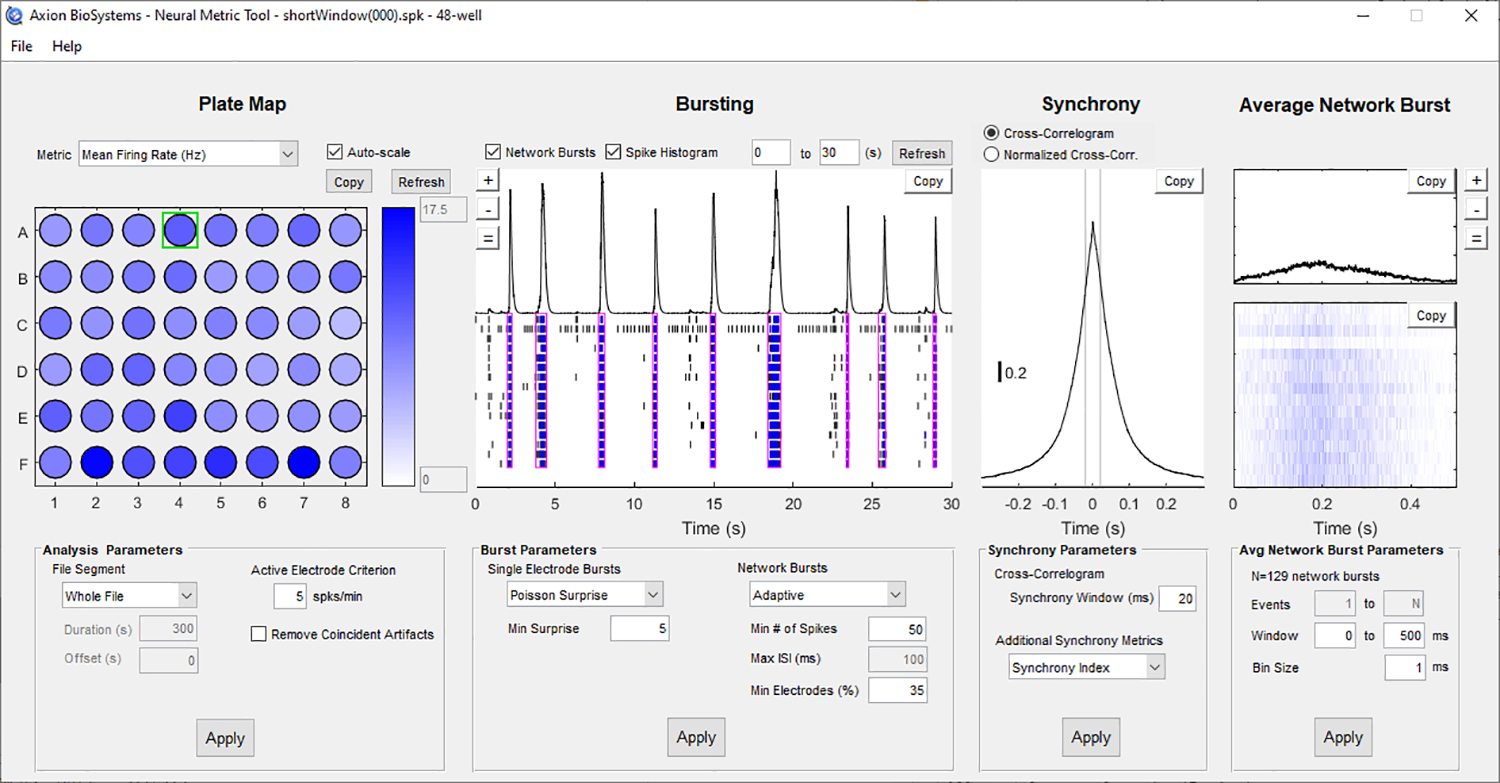
Analysis and visualization of unit-based activity, synchrony, network bursting
The Neural Metric Tool provides metrics for each detected unit, providing insight into the modulation of individual unit activity, as well as high resolution rasters depicting the contribution of each unit to network events. When Stimulation is present, evoked responses can be analyzed.
