Abstract
Cell counting is vital to biological assays, potency assessment, and manufacturing of cell-based products. However, quantifying the quality of cell counting methods is difficult due to the lack of stable cell samples of known quantity for use as reference material. Here, we present the evaluation and validation of the Maestro impedance assay for cell counting using a dilution series experiment on the HeLa cell line, in accordance with the ISO 20391-2 standard published in 2019. This standard outlines the use of precision and proportionality metrics for assessing the quality of cell counting methods in the absence of stable, known reference materials. Overall, the Maestro exhibited high precision across independent test samples and well replicates, as well as strong proportionality to cell quantity as measured by dilution fraction.
Introduction
Measuring cell quantity is fundamental to many biological assays. For cell-based products, accurate and precise measurement of cell quantity is vital for potency assays, comparing cell manufacturing processes, and as a key quality attribute for the release of cell-based therapies. Thus, there is a need for validated, robust assays for viable cell counting. Furthermore, compliance with GxP and 21 CFR Part 11 relies on system validation for use in cell-based product manufacturing. Evaluation and validation of the quality of cell counting methods is difficult due to the lack of a standardized reference material of known and stable cell quantity. This is further compounded by the wide range of cell types and dynamic behaviors, requiring fit-for-purpose validation.
To address this need, the International Organization for Standardization (ISO) Biotechnology committee recently published ISO 20391-1 and -2 outlining a standardized approach to quantifying cell counting performance. The ISO approach evaluates the quality of cell counting methods based on the principle of proportionality across a series of dilution fractions, or progressively lower cell quantities, of a stock cell solution. Accurate cell counting measurements should scale proportionally with cell quantity, such that a change in dilution fraction results in a proportional change in the cell quantity measurement. In addition, replicate sampling and observations are used to evaluate the precision of the measurement method.
Here, we validated the Axion BioSystems’ Maestro impedance assay for measuring cell quantity using a well-controlled dilution series experiment with HeLa cells, a ubiquitous human cervical cancer cell line (Gey et al 1952; Lucey et al 2009). The Maestro uses impedance technology to measure the number of viable cells present on the electrodes by passing a small electrical current.
In the absence of cells, impedance to current flow is low. When cells are seeded and attach to the electrodes, impedance increases proportionally to the number of cells. When cells die, they break apart from the surface and impedance to current flow declines back towards baseline.
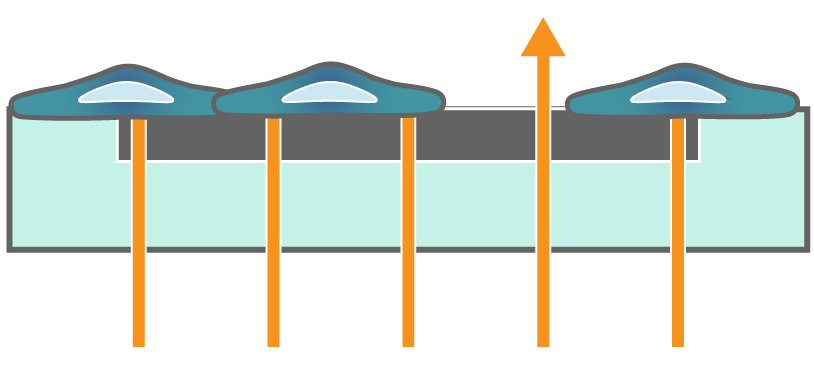
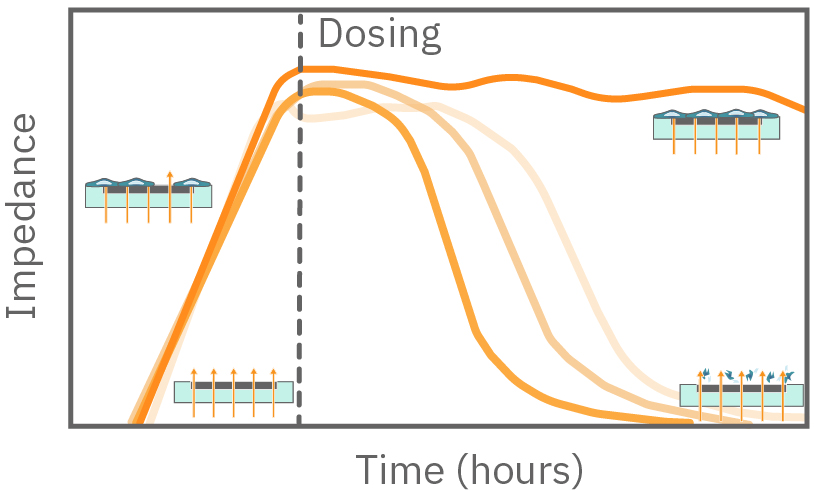
Figure 1. Impedance measures how much electrical signal (teal-colored arrows) is blocked by the electrode-cell interface (right). When the electrode is uncovered, electrical signal easily passes and the impedance is low. When cells cover the electrode, less electrical signal passes and the impedance is high. When cells die or detach, the impedance decreases back towards baseline.
The quality of the Maestro impedance assay for cell counting was assessed for precision and proportionality to cell quantity, as represented by dilution fraction. In accordance with the ISO 20391-2 standard, the coefficient of variation (CV) was used to assess precision across samples and the coefficient of determination (R2) and proportionality index (PI) were used to assess proportionality fit and systematic deviations from proportionality. Overall, the Maestro impedance assay exhibited high precision and proportionality to cell quantity.
Materials and Methods
Materials
Cells and reagents
HeLa (Cat. CCL-2) cells were obtained from ATCC (Manassas, VA). Media was prepared using MEM base media (Gibco, Cat 11095072), 10% FBS, and 1% penicillin/streptomycin.
CytoView-Z 96 plate
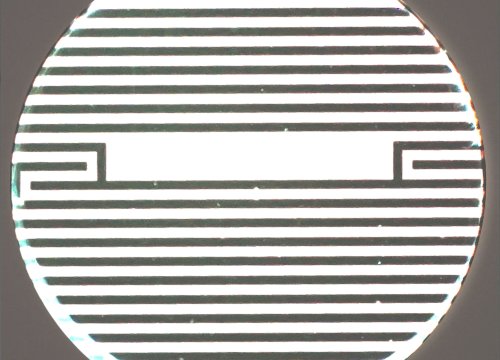
CytoView-Z 96-well plates (Axion BioSystems) were used for these experiments. The plate is composed of a polyethylene terephthalate (PET) surface with a gold recording electrode embedded in the culture surface of each well. Humidity reservoirs on the plate were filled with deionized water to maintain humidity.
Maestro Impedance-based assay platform
The Maestro platform (Axion Biosystems) uses impedance measurements (ohms, Ω) to quantify the presence and number of cells on the electrodes. To measure impedance, small electrical signals are delivered to the electrodes (Figure 1). Viable cells attach to the electrodes and block these signals and are detected as an increase in impedance. The increase in impedance is proportional to the density, or number, of cells seeded, and can vary across cell types. In this way, impedance is an indirect cell counting measure in which the number of cells is assessed by a proportional quantity, in this case impedance or resistance. For cell counting, measurements are made immediately after plating before the influence of proliferation begins. Since impedance is non-invasive and label-free, impedance assays can be used to quantify dynamic cellular responses over minutes, hours, and days. The Maestro Z has built-in environmental control, finely controlling temperature and CO2 throughout the measurements.
Methods
Stock solution preparation
Per ISO 20391-2, a stock solution was created containing a suspension of HeLa cells at a concentration of 55,556 cells per 100 µL. Briefly, HeLa cells were thawed and cultured according to the supplier recommendations, passaging as needed. Cells were detached from flasks and dissociated via trypsinization. Cell density and viability of the stock sample was determined using a hemacytometer and Trypan blue exclusion. The cell suspension was transferred to a 15 mL conical tube and centrifuged at 1,000 RPM for 5 minutes. The supernatant was aspirated, being careful not to disturb the cell pellet. Cells were resuspended and diluted in media to a working concentration of 55,556 cells per 100 µL, with care taken to ensure homogeneity before sampling.
Dilution fraction test sample preparation
Five linearly spaced target dilution fractions were chosen to span the dynamic range for HeLa cell densities on the Maestro, 0.9 (50k cells/well), 0.75 (41.67k cells/well), 0.6 (33.33k cells/well), 0.45 (25k cells/well), and 0.3 (16.67k cells/well). High dilution fractions mean less dilution and more cells, while low dilution fraction indicates more dilution and fewer cells. Note: Dilution fractions should be linearly spaced for the proportionality analysis described in the ISO 20391-2 standard. It is recommended to run a cell density sweep to determine the dynamic range for the intended purpose before performing a cell-based validation.
For each dilution fraction, four independent dilutions were performed to yield four independent test samples. The samples are denoted by red, green, purple, and blue in subsequent figures. Each sample was then weight verified using a calibrated scale. The measured dilution fraction for each sample was calculated as the mass of the cell suspension divided by the total sample mass. Measured dilution fraction was used in analyses to reduce the influence of pipetting or sampling error on the quality assessment. After preparing the plate and recording a baseline measurement, four replicate wells were seeded with cells from each test sample, yielding four replicate observations per test sample (Figure 2).
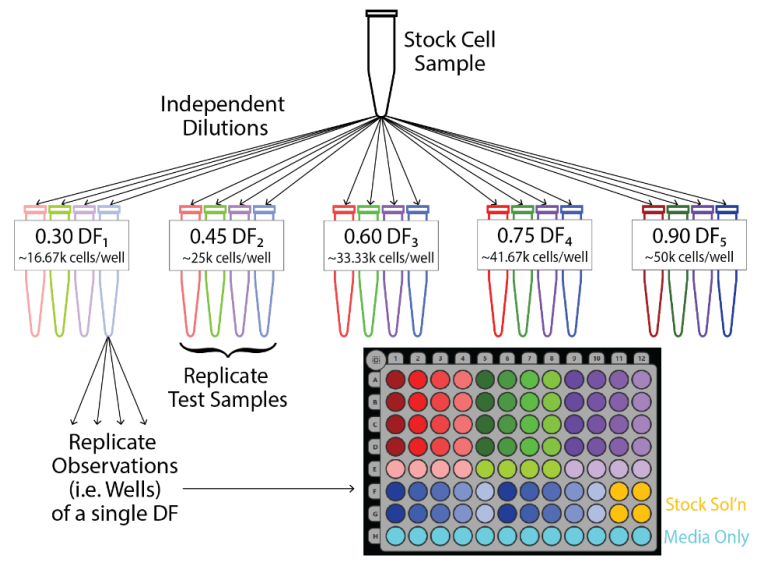
Figure 2. Experimental design for dilution series experiment. Four replicate test samples were created via independent dilutions from the stock cell suspension for each target dilution fraction, DF. Upon creation, the test samples were weighed, yielding a distinct DF measured for each test sample. Four replicate wells were then seeded from each test sample according to the CytoView-Z platemap shown in the bottom right.
CytoView-Z 96 plate preparation
To prepare the plate for cell culture, CytoView-Z plates were coated with 100 µL of fibronectin solution (1µg/mL) per well. Surface coated plates were incubated at 37°C and 5% CO2 for at least 1 hour. After incubation, excess surface coating was aspirated from each well. Then, 100 µL of complete medium was added per well and docked on the Maestro to record a media only baseline measurement.
After baseline measurement, cells from each test sample were seeded into four replicate wells for a working concentration of cells per 100 µL. The plate was then allowed to sit at room temperature for at least 1 hour to allow cells to settle and minimize thermal gradient-induced edge effects. The plate was then transferred back to the Maestro for impedance monitoring, with data from each well acquired once per minute.
Data Analysis
To measure the cell quantity, resistance at 41.5 kHz (change from baseline) was measured at approximately 1 hour after returning the plate to the Maestro to allow attachment but not significant proliferation. High frequency resistance, a component of the measured impedance, was selected as is it most sensitive to the number of cells present and less sensitive to specific characteristics of the cells, such as tight junctions. Data were then averaged across 30 minutes using the AxIS Z Display Interval, and a lab notebook was exported from AxIS Z. Subsequent statistical analyses were performed in Excel and R Studio per methods described in Sarkar et al 2017 and ISO 20391-2 (Sarkar et al 2017; ISO 20391-2).
The goal of the subsequent analyses was to quantify precision and proportionality of the Maestro impedance assay using the three quality metrics, coefficient of variation (CV), proportional model fit (R2 ), and proportionality index (PI) (Sarkar et al 2017; ISO 20391-2). Further details of the equations and computations are provided in the Appendix.
Precision describes how consistent measurements are across independent test samples. The coefficient of variation (CV) quantifies how large the variability of the test sample resistances is relative to the mean measurement (i.e. resistance). A CV value was computed for each target dilution fraction.
Proportionality describes how well the measurement (i.e. resistance) scales with cell quantity, which is represented by the measured dilution fraction. For an ideal cell counting, the measured response should be linearly proportional to the measured dilution fraction. To assess overall proportionality, a best fit proportional model (i.e. a line with constant slope and y-intercept of zero) was fitted and the R2 value computed. An R2 of one means that the measurement was perfectly proportional to the measured dilution fraction. More specifically, R2 describes the percentage of variance in the measurement explained by the variance in the cell quantity.
To assess systematic deviation from proportionality, the proportionality index (PI) was used. Two types of errors contribute to deviations from proportionality, random noise (e.g. imprecision) and systematic deviations. The PI reduces the influence of random noise by first smoothing data (see Appendix) before computing the residuals, or deviations from proportionality. The residuals are then scaled by the predicted proportional cell quantity, as sample variance is assumed to scale with sample mean per a quasi-Poisson model (Sarkar et al 2017; Ver Hoef and Boveng 2007). Finally, the PI is computed as the sum of the smoothed scaled residuals across test samples. A lower PI represents less systematic deviation from proportionality.
Results
Resistance at 41.5 kHz was highly consistent across test samples of the same dilution fraction and across replicate wells. Consistency across wells is evidenced by the small error bars for each sample in Figure 3. Resistance also scaled linearly across increasing dilution fractions. This is summarized in Figure 3. Higher dilution fractions (darker bars), or more cells, report a higher resistance, whereas lower dilution fractions (lighter bars), or fewer cells, report a lower resistance.
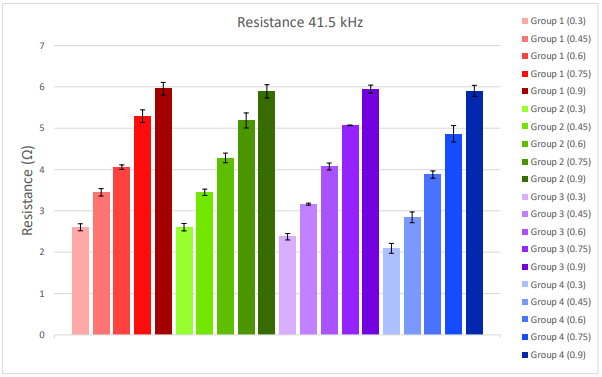
Figure 3. Resistance at 41.5kHz was collected within an hour of placing the CytoView-Z 96 well plate on the Maestro Z. Data was averaged over 30 minutes. Each bar represents the mean and standard deviation across replicate wells for a given test sample and dilution fraction. Lower dilution fractions are represented as lighter colors on the left of each group, and higher dilution fractions are represented as darker colors on the right of each group.
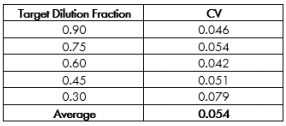
The CV for each target dilution fraction is reported in Table 1. The Maestro exhibited high precision across test samples (colors in Figure 1), as evidenced by low CV values. The average CV of 0.054 suggests that the standard deviation across samples was only ~ 5% of the measured cell quantity. The CV values for the Maestro are consistent with those reported for automated cell counters and lower than those reported for “gold standard” manual cell counting methods (Sarkar et al 2017), despite the multi-functionality and long-term monitoring possible with the Maestro in contrast to traditional counters.
The Maestro closely adhered to proportionality, with resistance at 41.5 kHz scaling proportionally with dilution fraction with a fitted slope of 6.92 ohms and R2 = 0.993 (Confidence Interval = 0.989 – 0.994, Figure 4). The high R2 suggests that the individual samples deviated little from proportionality and most of the variability in measured resistance is explained by the measured dilution fraction. Similarly, systematic deviation from proportionality was quite low, with a PI = 1.16. These quality metrics are both similar to that reported for automated cell counting, with proportionality exceeding (higher R2 and lower PI) that reported for manual counting methods.
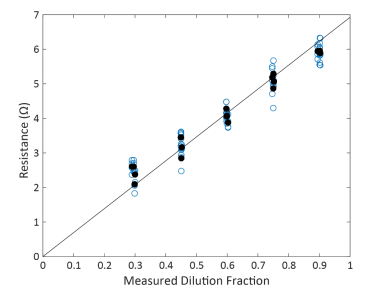
Figure 4. Maestro Resistance scaled proportionally across dilution fractions. Each blue dot represents a single well replicate of a test sample at the dilution fraction. Black solid dots represent the average across well replicates for a single test sample
Conclusion
The Maestro Impedance Assay was highly precise across samples and replicates and exhibited proportionality across dilution fractions. High precision gives confidence in repeated measures of cell quantity and provides sensitivity to even small changes in cell quantity. Proportionality across the tested range establishes the dynamic range over which cell quantity can be accurately measured for a particular cell type.
The Maestro’s performance for measuring cell quantity was superior to “gold standard” manual counting methods and similar to other automated cell counting systems that only measure cell number. Unlike manual methods, the Maestro is automated and easy to-use, making it suitable for high throughput applications and methods that require minimization of human error and variability. Unlike most direct automated measures, the Maestro bioelectronic assay is not an endpoint assay, in which only one time point is assessed. Rather, impedance can be continually monitored well past these early time points to assess the dynamics of proliferation, compound response, cell signaling, and cell death with a resolution of 1 data point per minute.
Finally, this experimental design provides a template for fit-for-purpose system validation of the Maestro platform, which is particularly vital for manufacturing of cell-based products and compliance with GxP and 21CFR part 11 compliance. For each cell type and intended range of cell quantity, the quality of the Maestro impedance assay can be assessed and validated in accordance with ISO 20391-2 using the protocol outlined here.