Measure cell health, treatment response, and cell-death kinetics continuously with a label-free, impedance-based assay.
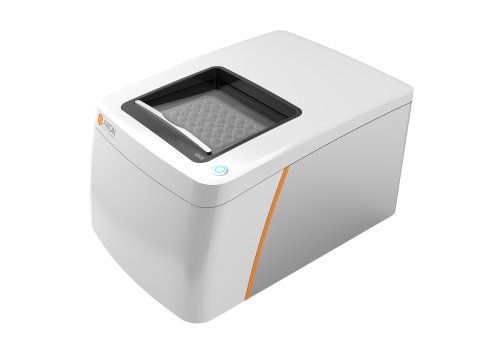
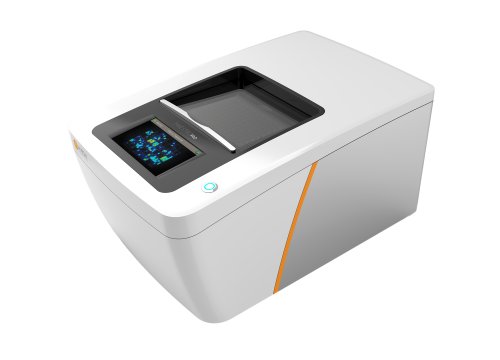
The Maestro Z platform monitors changes in cell attachment, morphology, proliferation, and death throughout an experiment. Unlike conventional endpoint assays, real-time impedance measurements show both the magnitude and timing of a treatment response without requiring fluorescent labels or destructive reagents.
Using the same plate, researchers can evaluate cell viability, percent cytolysis, kill-time kinetics, dose-response relationships, and EC50 values at multiple timepoints.
In vitro real time, label free cytotoxicity assays
-
Doxorubicin dose-response analysis in SKOV3 cells>
-
Calculating percent cytolysis and kill time in real time>
-
Comparison with an MTT endpoint assay>
-
Reproducibility across four 96-well plates>
The effect of a cytotoxic treatment can depend on both concentration and exposure time. Continuous impedance measurements make it possible to observe the response across a concentration range and generate dose-response curves at multiple timepoints from the same experiment.
In this study, SKOV3 cancer cells were plated at 5,000 cells per well in a CytoView-Z 96-well plate. After 24 hours, the cells were treated with nine concentrations of doxorubicin in half-log increments ranging from 0.01 to 100 µM.
Increasing concentrations of doxorubicin produced progressively lower resistance measurements, indicating greater loss of cell attachment and viability. Cytolysis was calculated by comparing the treatment response with the no-treatment control.
The Hill equation was fitted to cytolysis measurements collected 72 hours after treatment. The calculated EC50 for doxorubicin was 0.43 µM.
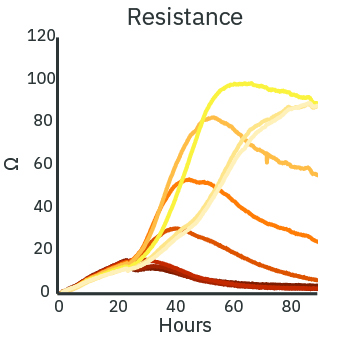
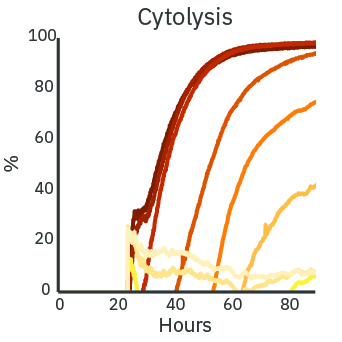
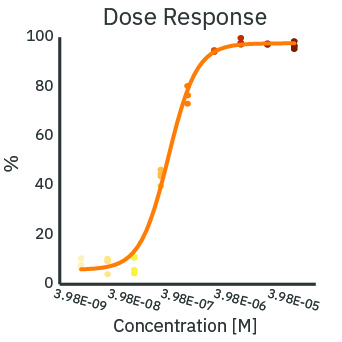
SKOV3 cancer cells were plated at 5,000 cells per well in a CytoView-Z 96-well plate. After 24 hours, cells were treated with nine concentrations of doxorubicin ranging from 0.01 to 100 µM. Increasing doxorubicin concentrations produced lower resistance measurements and greater cytolysis. Dose-response analysis at 72 hours post-dose produced a calculated EC50 of 0.43 µM.
Why the complete time course matters
A dose-response relationship can change during an experiment. An endpoint selected too early may underestimate a delayed cytotoxic response, while a later endpoint may obscure differences in response kinetics.
Real-time measurements allow dose-response curves and EC50 values to be evaluated at multiple stages of the same experiment. Researchers can select an analysis timepoint based on the observed biology rather than choosing one before the treatment response is known.
The final extent of cell death is only one component of a cytotoxic response. The time required for a treatment to produce that effect can provide additional information about treatment activity and mechanism.
The Maestro Z platform continuously records changes in impedance after treatment. Using an untreated cell-growth control and a full-lysis control, the response can be normalized to calculate percent cytolysis throughout the experiment.
The resulting time-course data can also be used to calculate kill time 50, the amount of time required for a treatment to produce 50% cytolysis under the selected experimental conditions.
In the example shown, A549 cells were treated with doxorubicin 24 hours after plating and monitored for an additional 36 hours. The continuous measurements captured the progression of treatment-induced cytolysis and enabled kill time 50 to be calculated from the same experiment.
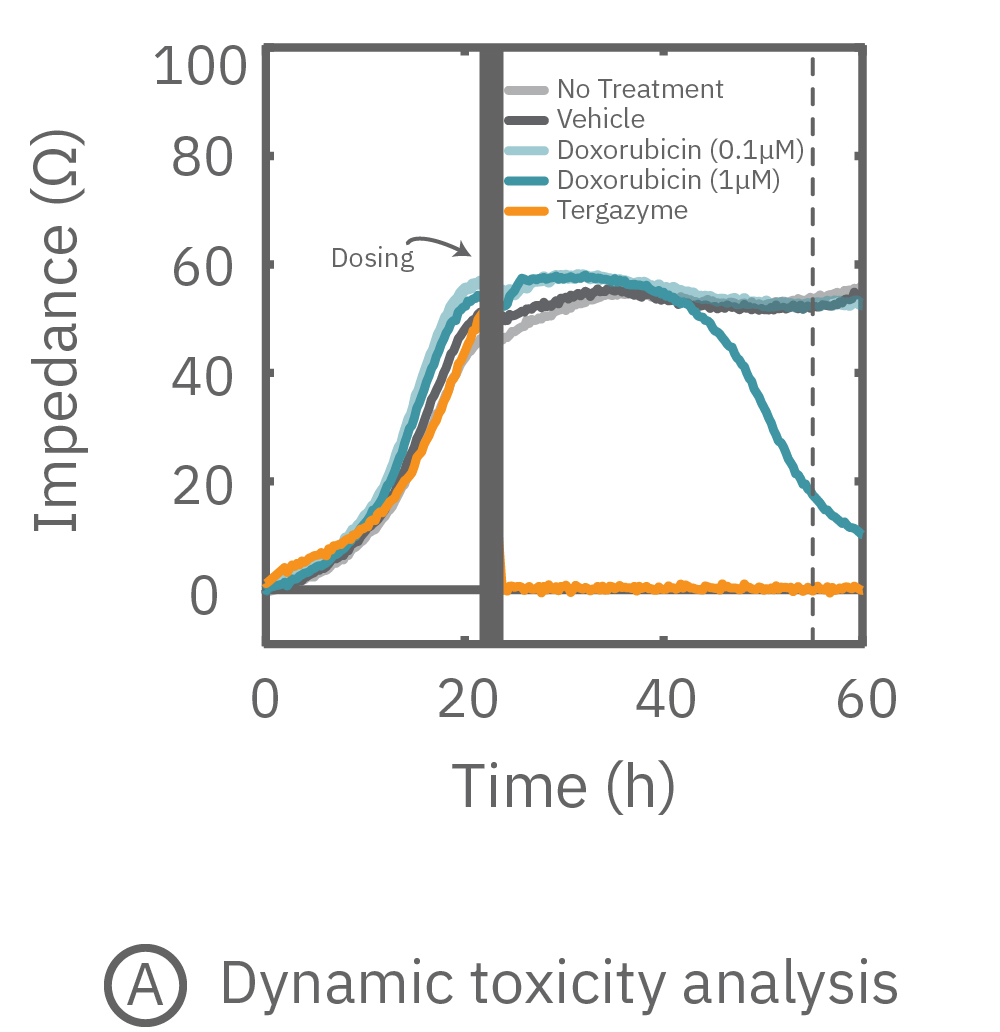
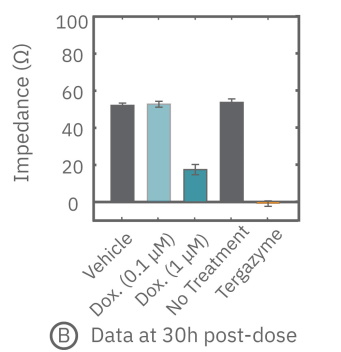
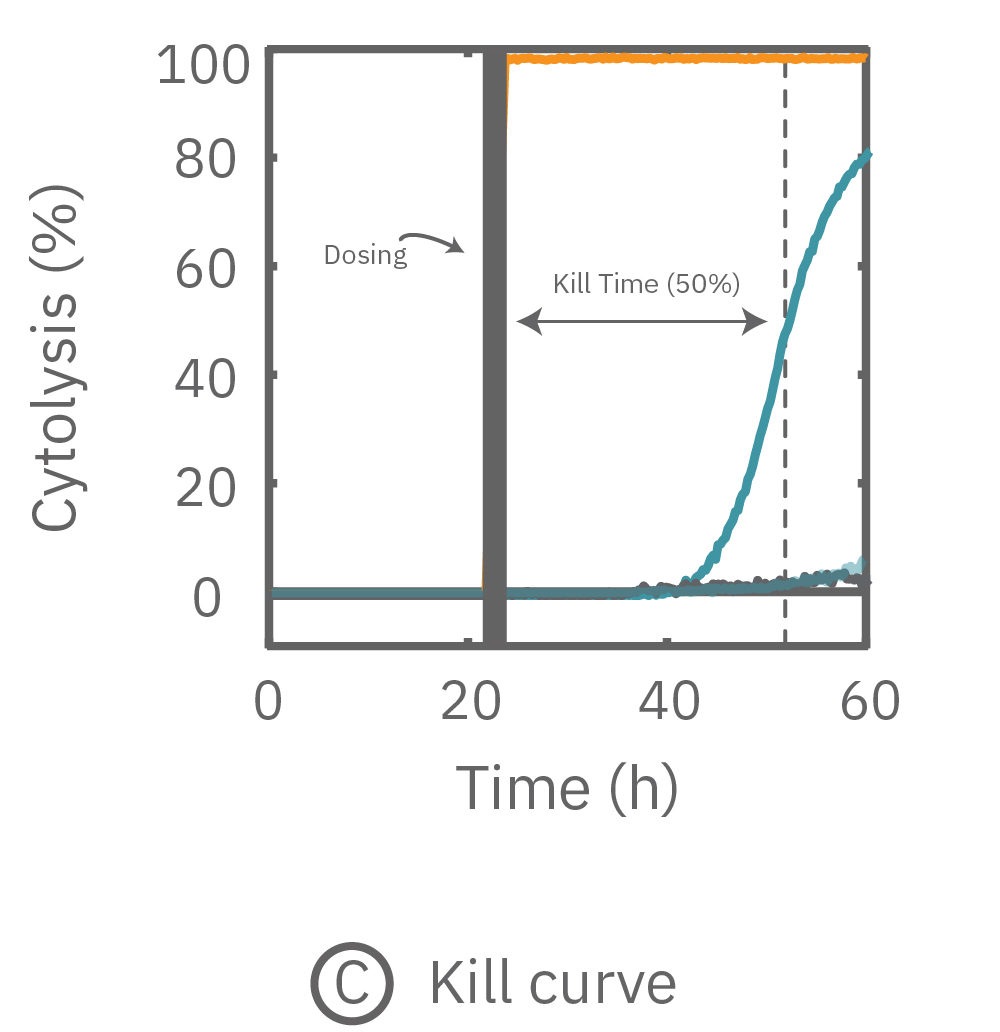
A549 cells were treated with doxorubicin 24 hours after plating and monitored for an additional 36 hours. Measurements from no-treatment and full-lysis controls were used to calculate percent cytolysis continuously and determine the time required to reach 50% cytolysis.
The figures above highlight the dynamic cytotoxic response over time. The percentage of cytolysis, or cell death, can be tracked in real time, and the time to 50% cell death (kill time50) provides insight into the kinetics and efficacy of a treatment's cytotoxicity.
All products and application data are for research use only and not intended for human diagnostic or therapeutic uses.
Distinguishing rapid and delayed cytotoxicity
Two treatments may produce similar levels of cell death at the final endpoint but reach that result at different rates.
Continuous cytolysis measurements help distinguish rapid, gradual, and delayed responses that could appear equivalent in a conventional endpoint assay. These kinetic differences may be useful when comparing compounds, concentrations, treatment combinations, or cell models.
Impedance increases as adherent cells attach, spread, and cover the electrode area. This relationship allows impedance to serve as a label-free indicator of relative cell number, growth, and viability.
In the example shown, Calu-3 cells were plated at densities ranging from 6,400 to 51,200 cells per well. Impedance measurements collected four hours after plating increased linearly with cell number and closely correlated with MTT measurements across the same range of cell densities.
Unlike an MTT assay, however, impedance measurements are not limited to a single endpoint. The same wells can be monitored before treatment, during the response, and through the end of the experiment without adding assay dyes or destroying the cell culture.
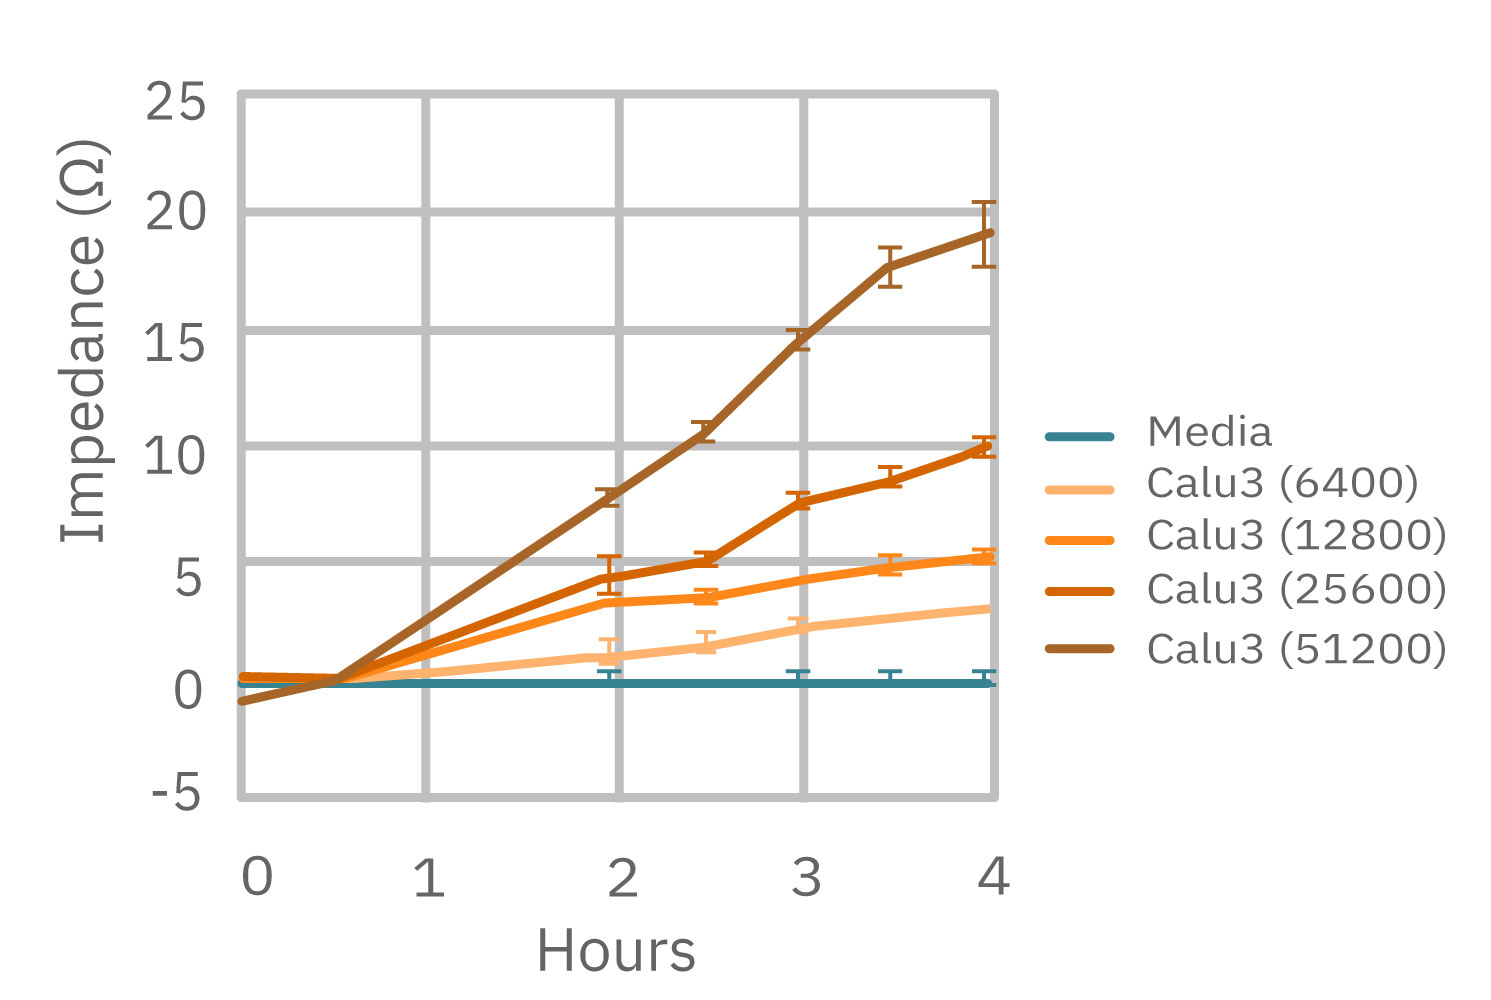
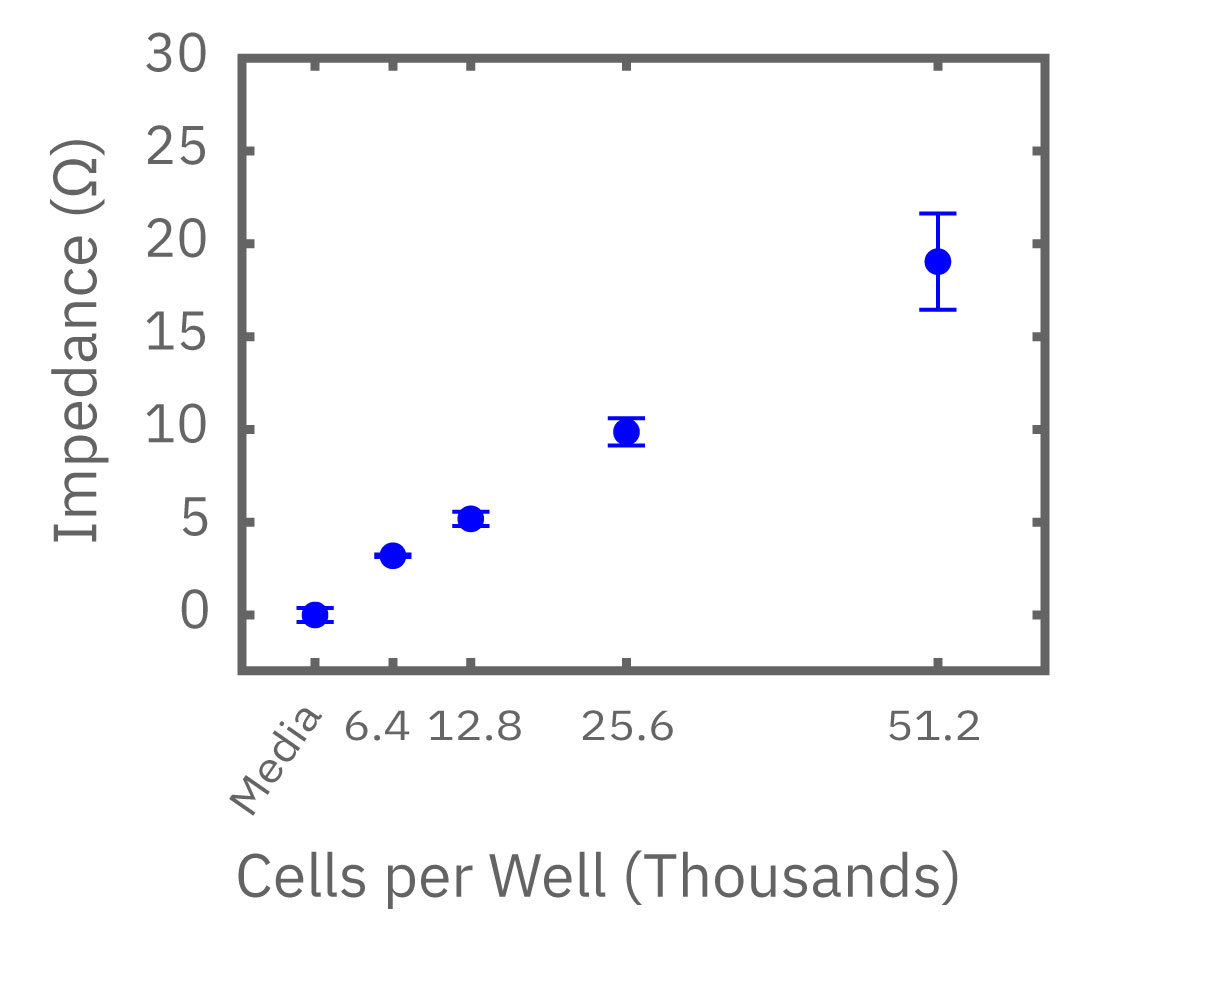
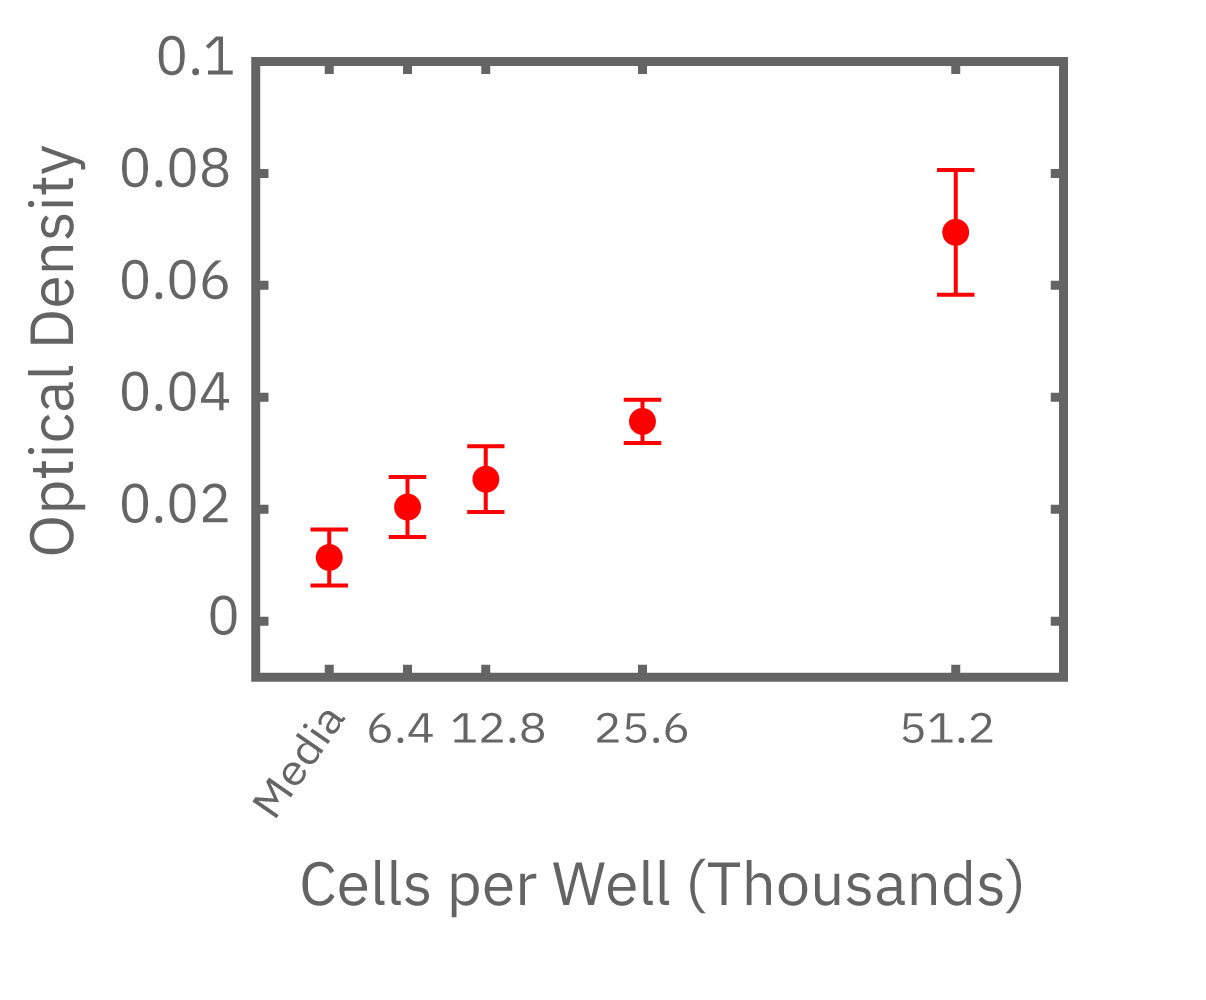
Calu-3 cells were plated at densities ranging from 6,400 to 51,200 cells per well. Impedance measured four hours after plating increased linearly with cell number and correlated with measurements from an optical MTT assay. Unlike the endpoint measurement, impedance can be recorded continuously from the same wells.
Information gained beyond the endpoint
Correlation with an established endpoint assay supports the use of impedance as an indicator of relative cell number and viability.
Continuous impedance measurements also provide information that a single MTT measurement cannot capture, including:
- the condition of the cells before treatment;
- the onset of the treatment response;
- changes in response rate;
- temporary stabilization or recovery;
- the relationship between treatment duration and viability.
Real-time impedance assays can be scaled to evaluate multiple treatments, concentrations, and experimental conditions while preserving the complete response time course.
In this study, SKOV3 cells were plated in four CytoView-Z 96-well plates. Twenty-four hours after cell seeding, the cells were treated with two test compounds using six-point concentration ranges with full-log intervals.
Cytolysis was calculated relative to no-treatment and full-lysis controls. Dose-response analysis was performed separately for each compound and plate.
The calculated EC50 values were similar across the replicate plates, with low overall percent coefficient of variation. The results demonstrate reproducible dose-response measurements across multiple plates.
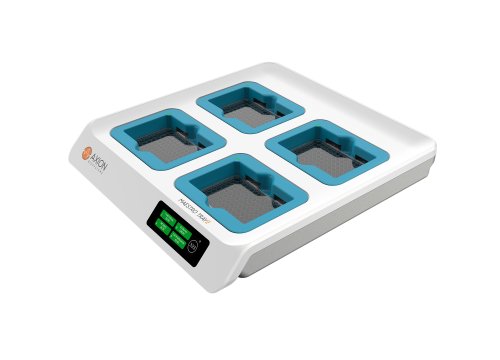
The Maestro TrayZ platform enables simultaneous impedance measurements from four plates, allowing researchers to evaluate more compounds, cell models, concentrations, or experimental conditions in parallel.
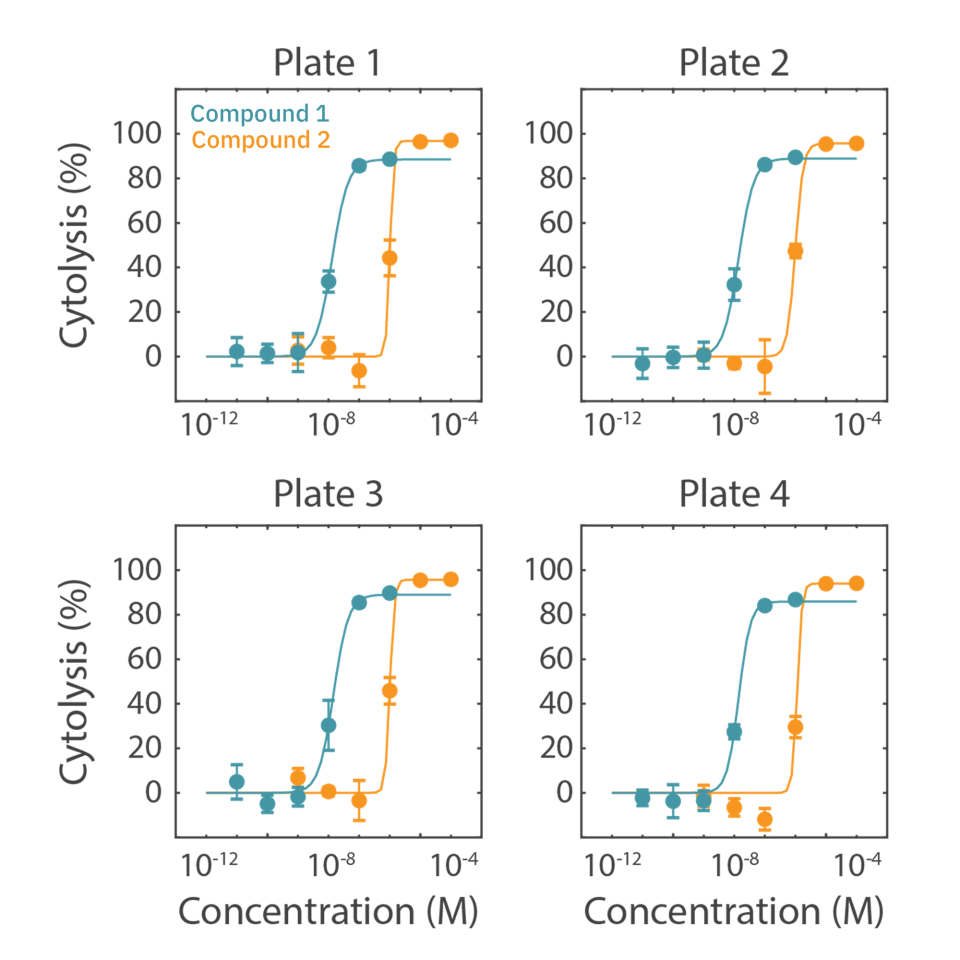
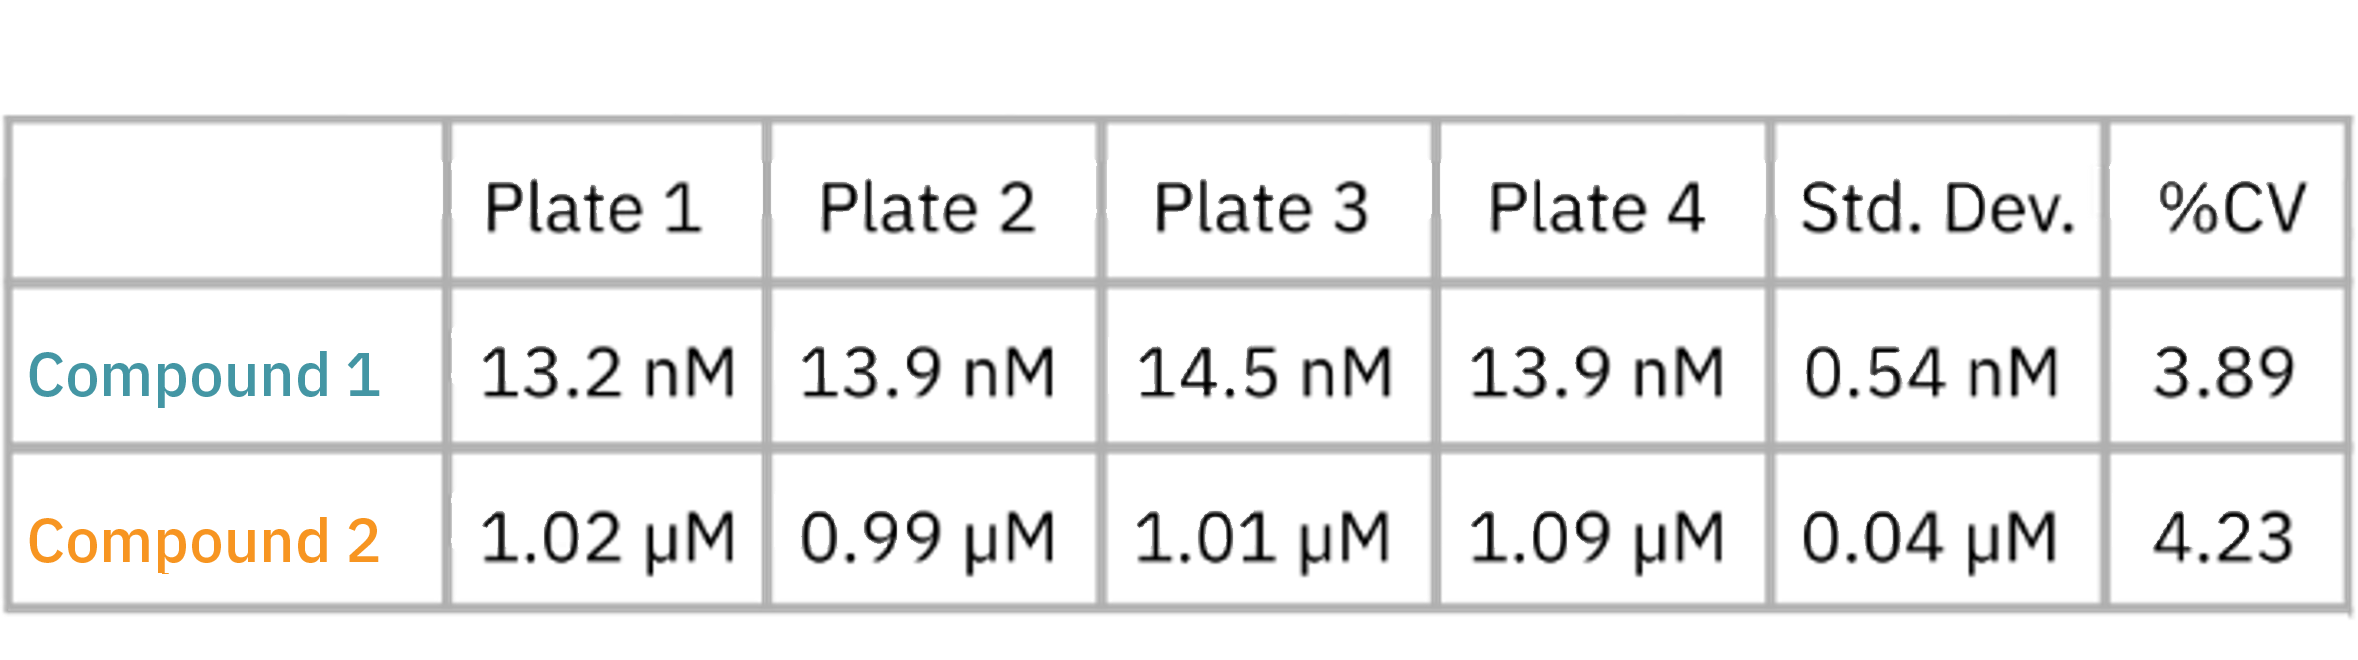
SKOV3 cells were plated in four CytoView-Z 96-well plates and treated with two compounds using six-point concentration ranges. Dose-response analysis produced similar EC50 values across the replicate plates, with low overall plate-to-plate variability.
Scaling cytotoxicity studies without losing kinetic data
High-throughput cytotoxicity studies require both experimental scale and consistency.
Multi-plate real-time measurements allow researchers to increase throughput while evaluating:
- plate-to-plate variability;
- concentration-dependent effects;
- differences in treatment kinetics;
- EC50 reproducibility;
- the performance of controls across multiple plates.
Explore Multi-Plate Cytotoxicity Analysis with Maestro TrayZ
Benefits of Maestro Z cytotoxicity and cell viability assays
>> Label-free measurements — Monitor changes in cell attachment, morphology, proliferation, and death without fluorescent labels or colorimetric assay reagents.
>> Continuous response data — Capture the complete response before and after treatment instead of relying on one predefined endpoint.
>> Nondestructive analysis — Measure the same cell population repeatedly throughout the experiment.
>> Flexible timepoint selection — Evaluate results at multiple timepoints and select an endpoint after observing the treatment kinetics.
>> Dose-response and kinetic metrics — Calculate percent cytolysis, kill time, dose-response relationships, and EC50 values from the same experiment.
>> Scalable throughput — Run experiments in 96-well plates and expand to simultaneous four-plate measurements with Maestro TrayZ or 384-well plates with Maestro ZHT.
Cytotoxicity results demonstrated with real-time impedance
Axion BioSystems’ application data demonstrate several uses of real-time impedance for cytotoxicity and cell viability research:
- In SKOV3 cancer cells, nine doxorubicin concentrations from 0.01 to 100 µM produced a concentration-dependent cytotoxic response.
- Dose-response analysis of the SKOV3 experiment produced a calculated doxorubicin EC50 of 0.43 µM at 72 hours post-dose.
- In A549 cells, continuous measurements captured percent cytolysis and the time required to reach 50% cytolysis.
- In Calu-3 cells, impedance increased linearly with cell number and correlated with measurements from a conventional MTT endpoint assay.
- Across four CytoView-Z 96-well plates, replicate dose-response experiments produced similar EC50 values with low plate-to-plate variability.
These experiments illustrate how real-time measurements can reveal treatment effects that may be missed or appear indistinguishable when viability is measured at only one endpoint.
Featured resources for cytotoxicity and cell viability assays
Explore application data, assay methods, protocols, and validation studies for designing and analyzing real-time impedance-based cytotoxicity experiments.
Tracking the Dynamics of Cytotoxicity in Real-Time with the Maestro Z Impedance Assay
Validation of an Impedance-based Cytotoxicity Assay for High Throughput Screening
Quantifying Proliferation and Cytotoxicity of Suspension Human Cancer Cell Lines Using the Maestro Z
Multiplate Cell-Based Assays with Maestro TrayZ for Cytotoxicity and Potency
Looking for additional methods or applications?
Request a demo.
Learn how Maestro Z platforms enable simple and reliable cytotoxicity and cell viability measurements.
Frequently asked questions about cytotoxicity assays
A real-time cytotoxicity assay continuously measures how cells respond before and after treatment. Impedance-based assays detect changes in cells as they attach, spread, proliferate, change morphology, or die.
Conventional endpoint assays provide a measurement at one selected time. Real-time measurements capture the complete response, allowing researchers to determine:
- when a cytotoxic effect begins;
- how quickly the response progresses;
- whether cells stabilize or recover;
- how the response changes with concentration;
- which timepoint is most appropriate for dose-response analysis.
Because impedance measurements are label-free and nondestructive, repeated measurements can be collected from the same cells without adding detection reagents at each timepoint. This also enables users to combine impedance assays with complementary tests, such as flow cytometry or cytokine release assays.
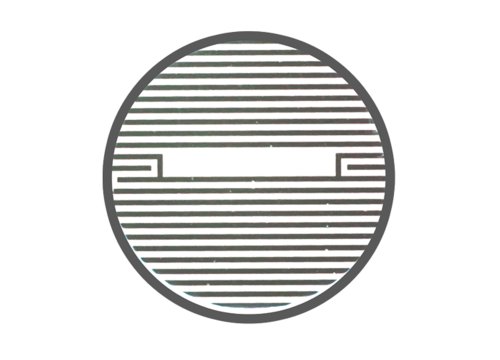
The assay measures resistance to a small electrical signal across electrodes embedded in the culture plate. Changes in cell attachment, spreading, morphology, proliferation, and death alter the measured impedance.
In the experiments shown on this page, impedance measurements were used to evaluate dose response, percent cytolysis, kill-time kinetics, relative cell number, and plate-to-plate reproducibility.
Both methods can provide information about relative cell number and viability. In the Calu-3 experiment shown here, impedance increased linearly with cell number and correlated with measurements from an optical MTT assay.
An MTT assay produces a measurement at one selected endpoint. Real-time impedance provides continuous measurements from the same wells without requiring assay dyes or destruction of the culture.
Yes. In the multi-plate experiment shown here, SKOV3 cells were evaluated across four CytoView-Z 96-well plates. Replicate dose-response studies produced similar EC50 values with low plate-to-plate variability.
Maestro TrayZ enables simultaneous impedance measurements from four plates for larger cytotoxicity and cell viability studies.